nparty - comparing House and Senate
My original goal with n-party-preferred analysis, back in 2016-2017, was to apply One Nation’s 2016 Senate performance to state seats to get a good idea of their between-seats variation. I could then apply state-level aggregate polling numbers to estimate results in each seat.
But people vote differently just between House and Senate in the federal election, let alone between elections! This is another reason for n-party-preferred analysis — usually it’s the same set of parties towards the end of the count. That’s the focus of this article.
We’ve done two-party-preferred analyses in the House for many years, and the AEC even conducts indicative two-party throws in seats which didn’t end up as Labor vs Coalition. But given the Senate’s optional preferential voting system it doesn’t quite make sense to do that; the 2PP exhaustion rate is a bit too high.
However, if you consider the tickets of every winning Senate candidate and the first runner-up candidate on an n-party-preferred basis, then there’s generally very little exhaustion, only a few percent. That’s low enough that it shouldn’t impact the results too heavily. Including the first runner-up is also justified on a Hare-quota consistency basis.
| Jurisdiction | Winners and runner-up (2022) | “Exhaust” rate |
|---|---|---|
| ACT | Labor, Pocock, Liberals | 2.06% |
| NT † | Liberals, Labor, Greens | 0.45% |
| NSW | L/NP, Labor, Greens, PHON | 2.26% |
| VIC | L/NP, Labor, Greens, UAP | 2.41% |
| QLD | L/NP, Labor, Greens, PHON | 2.64% |
| WA | L/NP, Labor, Greens, PHON | 1.66% |
| SA | L/NP, Labor, Greens, PHON | 1.50% |
| TAS | L/NP, Labor, Greens, JLN, PHON | 0.56% |
† Note that in the NT, the Greens and the Liberal Democrats were still in the count at the end, with the Greens on about 0.53 quotas and the Liberal Democrats on about 0.4 quotas. The very low “exhaust” rate is also potentially attributable to there being only eight tickets.
Today we’ll take a closer look at my home state of Queensland. Other states might be visited in the future, but also they are less likely to have a stable set of top-four parties.
Queensland 4CP-4PP comparison (2016-2022)
Here’s a presentation of the data for Queensland from 2016 onwards. Occasionally someone other than the big 4 finish in the top four, so those seat-year combinations are omitted.

We can see a pattern of Labor and the Coalition usually performing stronger in the House than the Senate, and vice-versa for the Greens and One Nation. This is consistent with the idea that some voters are happy to directly support Labor or the LNP for government in the House, but simultaneously are happy to support the Greens or One Nation in the Senate.
Sometimes a major party underperforms in the House, notably the LNP in Rankin and Oxley (likely reflecting high personal votes for Labor’s Jim Chalmers and Milton Dick).
The change in Labor and Greens performance in Griffith from 2019 to 2022 is quite notable; the logical conclusion is that in 2019 some left-wing voters supported Terri Butler (Labor) in the House but Greens in the Senate, then in 2022 Max Chandler-Mather earned their vote in the House too.
The House overperformance for the LNP in Leichhardt in 2022 likely reflects Warren Entsch’s personal vote.
It’s important not to draw too much from these narratives, as the single largest difference in the chart is only about 8% of voters. However, 8% of voters can still be quite a bit — in most federal elections the 2PP swing is less than 5%.
In the following sections I’ll draw trendlines for 2022 for both 4CPs and 3CPs. I’m not convinced about drawing trendlines for multiple election years without some sort of weighting for recency.
Queensland 4CPs (2022)
In 2022, twenty-two out of the thirty Queensland House seats had a “classic” 4PP finish (Liberal-Nationals, Labor, Greens and One Nation). The remaining eight seats had a mixture of Katter (2), independents (2), UAP (3) and LDP (1) candidates making the top four. The UAP & LDP seats had Greens as the third party, the KAP and independent seats had One Nation as the third party. Frustratingly for the analysis, some of these seats were quite good for either third party, including the seat of Ryan (won by the Greens, with LDP fourth).
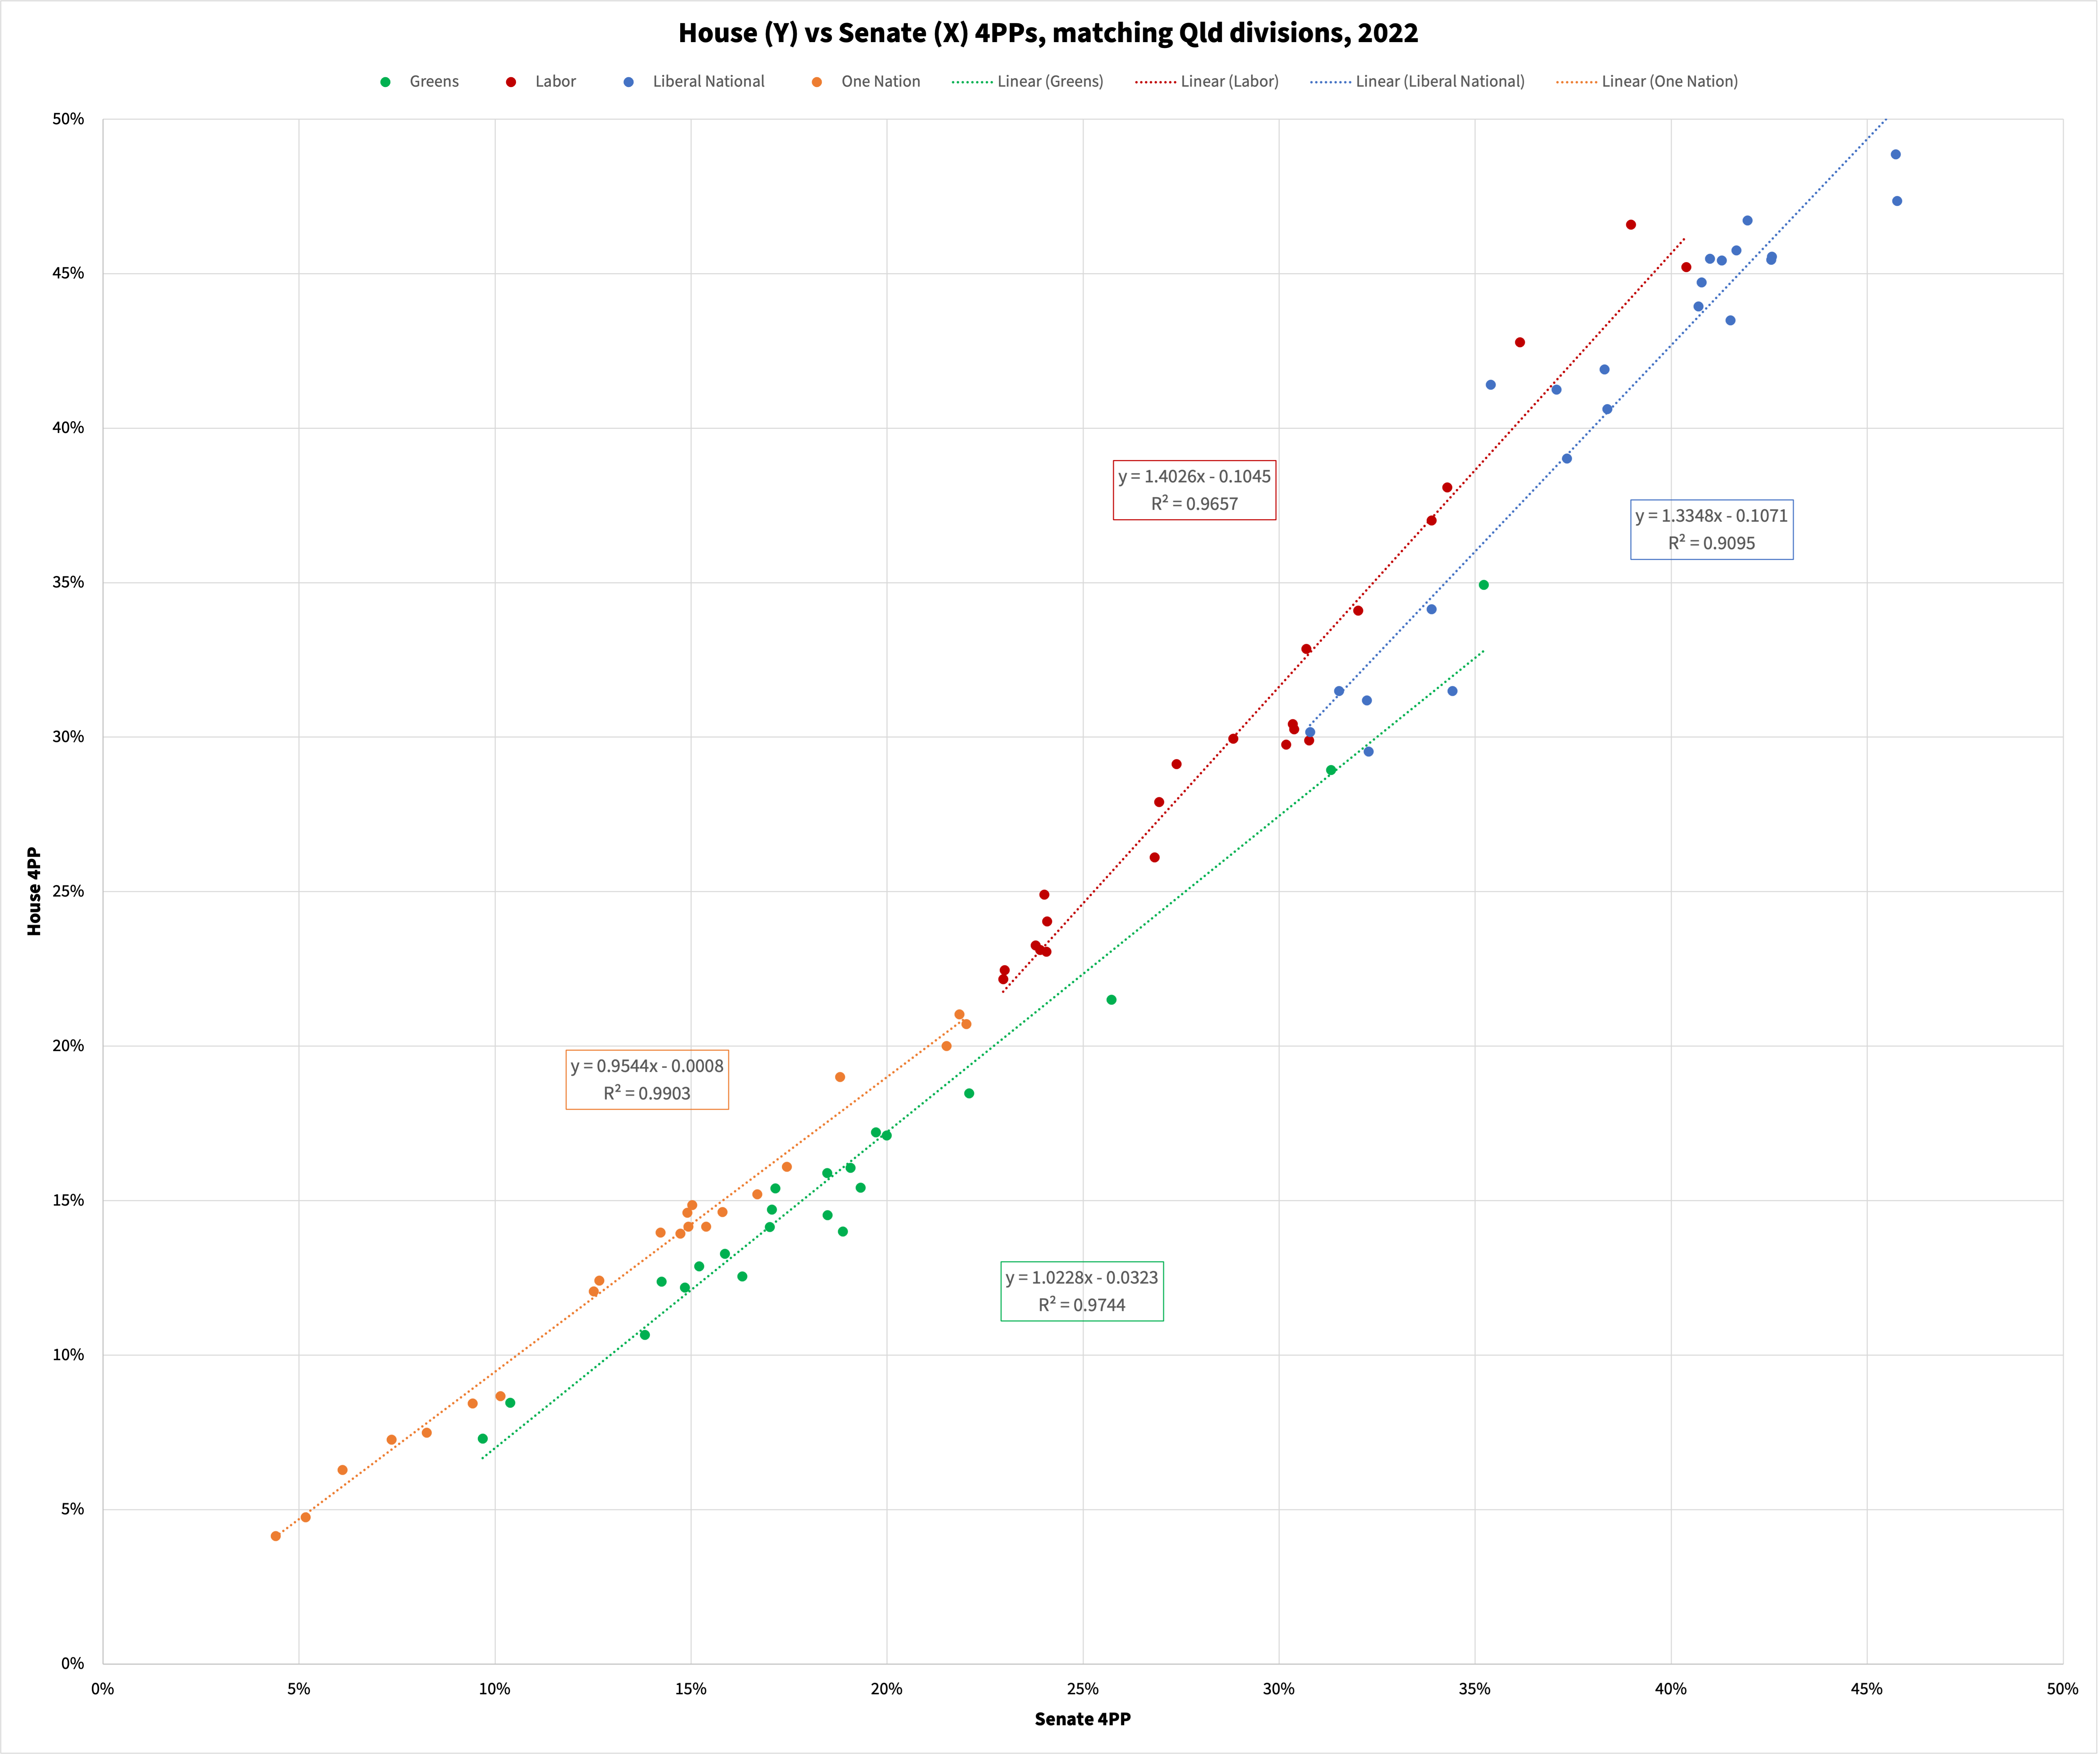
Comparing House and Senate 4PPs in those 22 available divisions, I tried fitting linear trend-lines, which got R-squared values above 95% for ALP, Greens and One Nation, while still above 90% for the Liberal-Nationals.
The general pattern seems to be that House results over-perform Senate results at the higher end but conversely underperform at the lower end. Sometimes this means the House vote is more efficiently distributed than the Senate vote, sometimes less - it depends on the range of the Senate vote!
The major parties show House over-performance increasing towards
their high end, with trendline equations of H = 1.4*S - 0.1
for Labor and H = 1.33*S - 0.11 for the LNP.
The Greens’ House results underperformed their Senate results
overall, but improved towards the high end
(H = 1.03*S - 0.3). In particular Griffith, their best
seat, was well above the trendline!
One Nation’s House results underperformed generally
(H = 0.95*S). This probably relates to One Nation not
actually winning any House seats (were they aiming to win, or just to
get a good result and support their Senate campaign?) and their
competition / relationship with KAP and UAP.
Queensland 3CPs (2022)
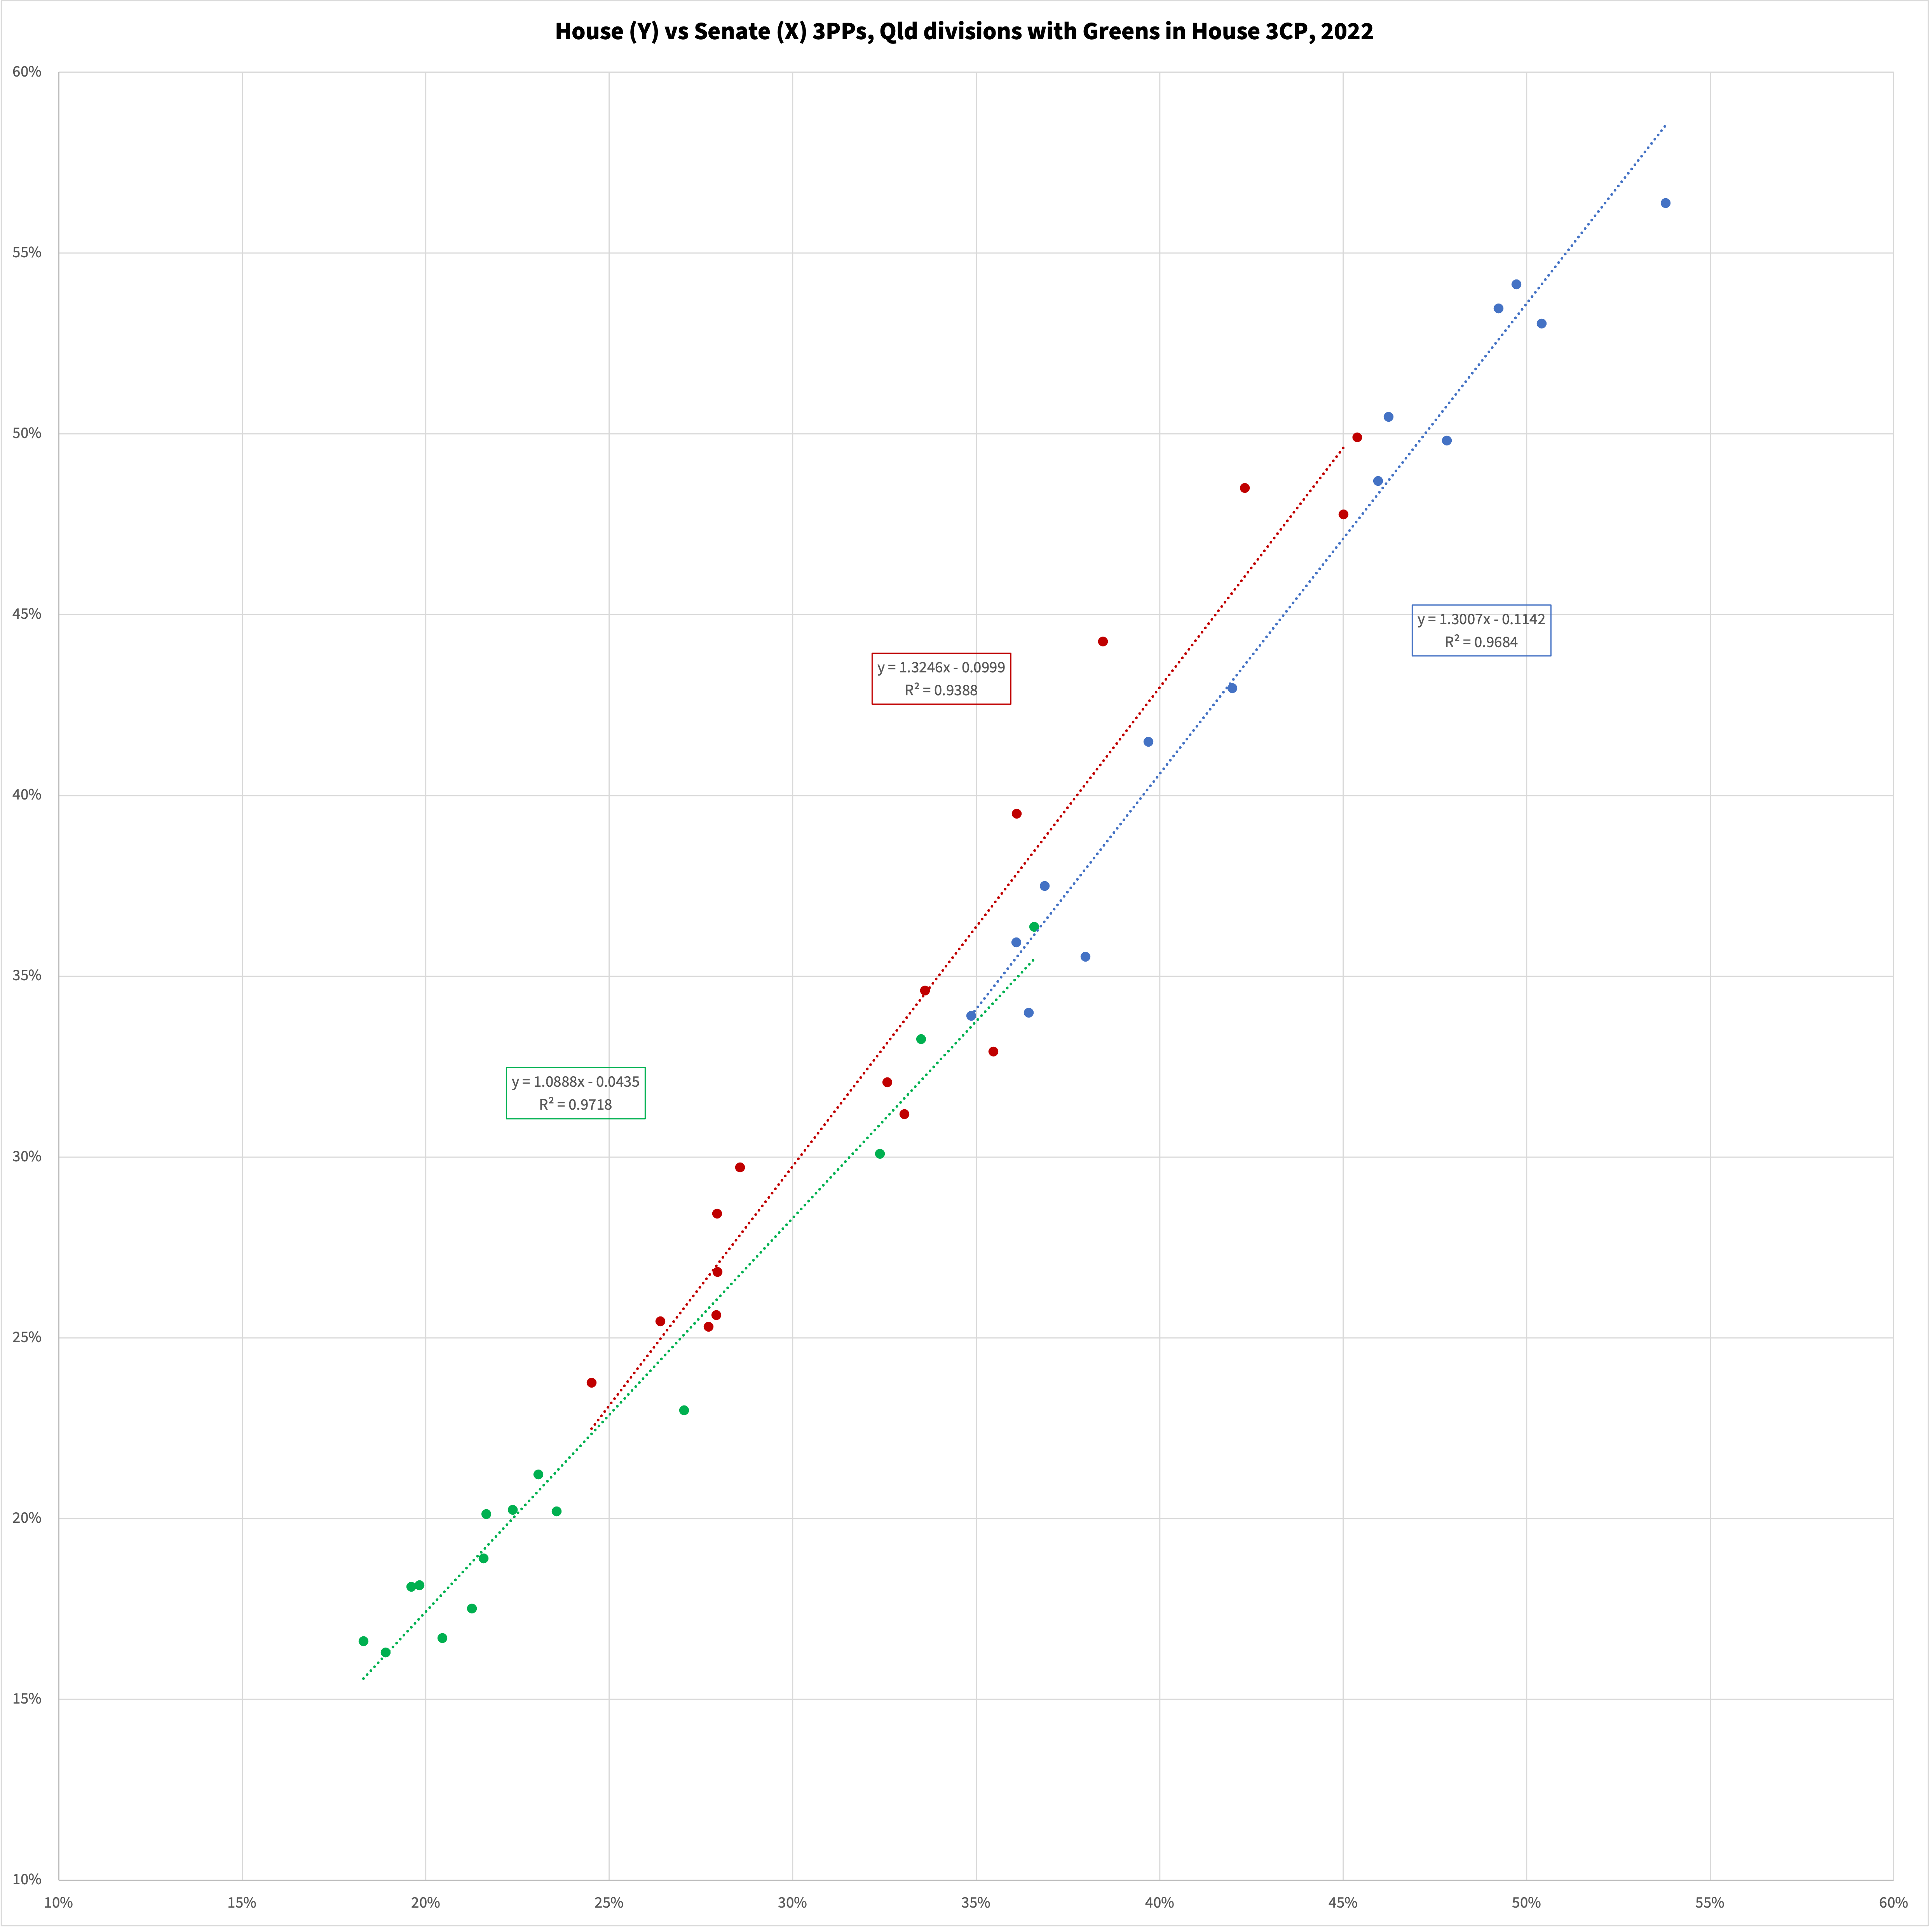
If we consider three-party results rather than four-party results then the four of the eight previously excluded seats can be included in the analysis, all Greens 3CPs.
In the Greens 3CP seats we see a trendline equation
ever so slightly closer to the majors than before, at
H = 1.09*S - 0.04, which is to say underperformance at the
low end and improvement towards the high end (though the crossover point
for the trendline is still above any actual results, in
Griffith and Ryan the Greens’ House 3PP came within half a percentage
point of their Senate result).
For Labor, we see a bit of a flattening (down to
H = 1.32*S - 0.1) and likewise for the LNP (down to
H = 1.3*S - 0.11). The LNP would probably prefer a flatter
gradient here — about a third of the seats here have an LNP 3PP of over
50%, and a couple of percent off those seats in exchange for a couple
percent more in Ryan would win the latter.
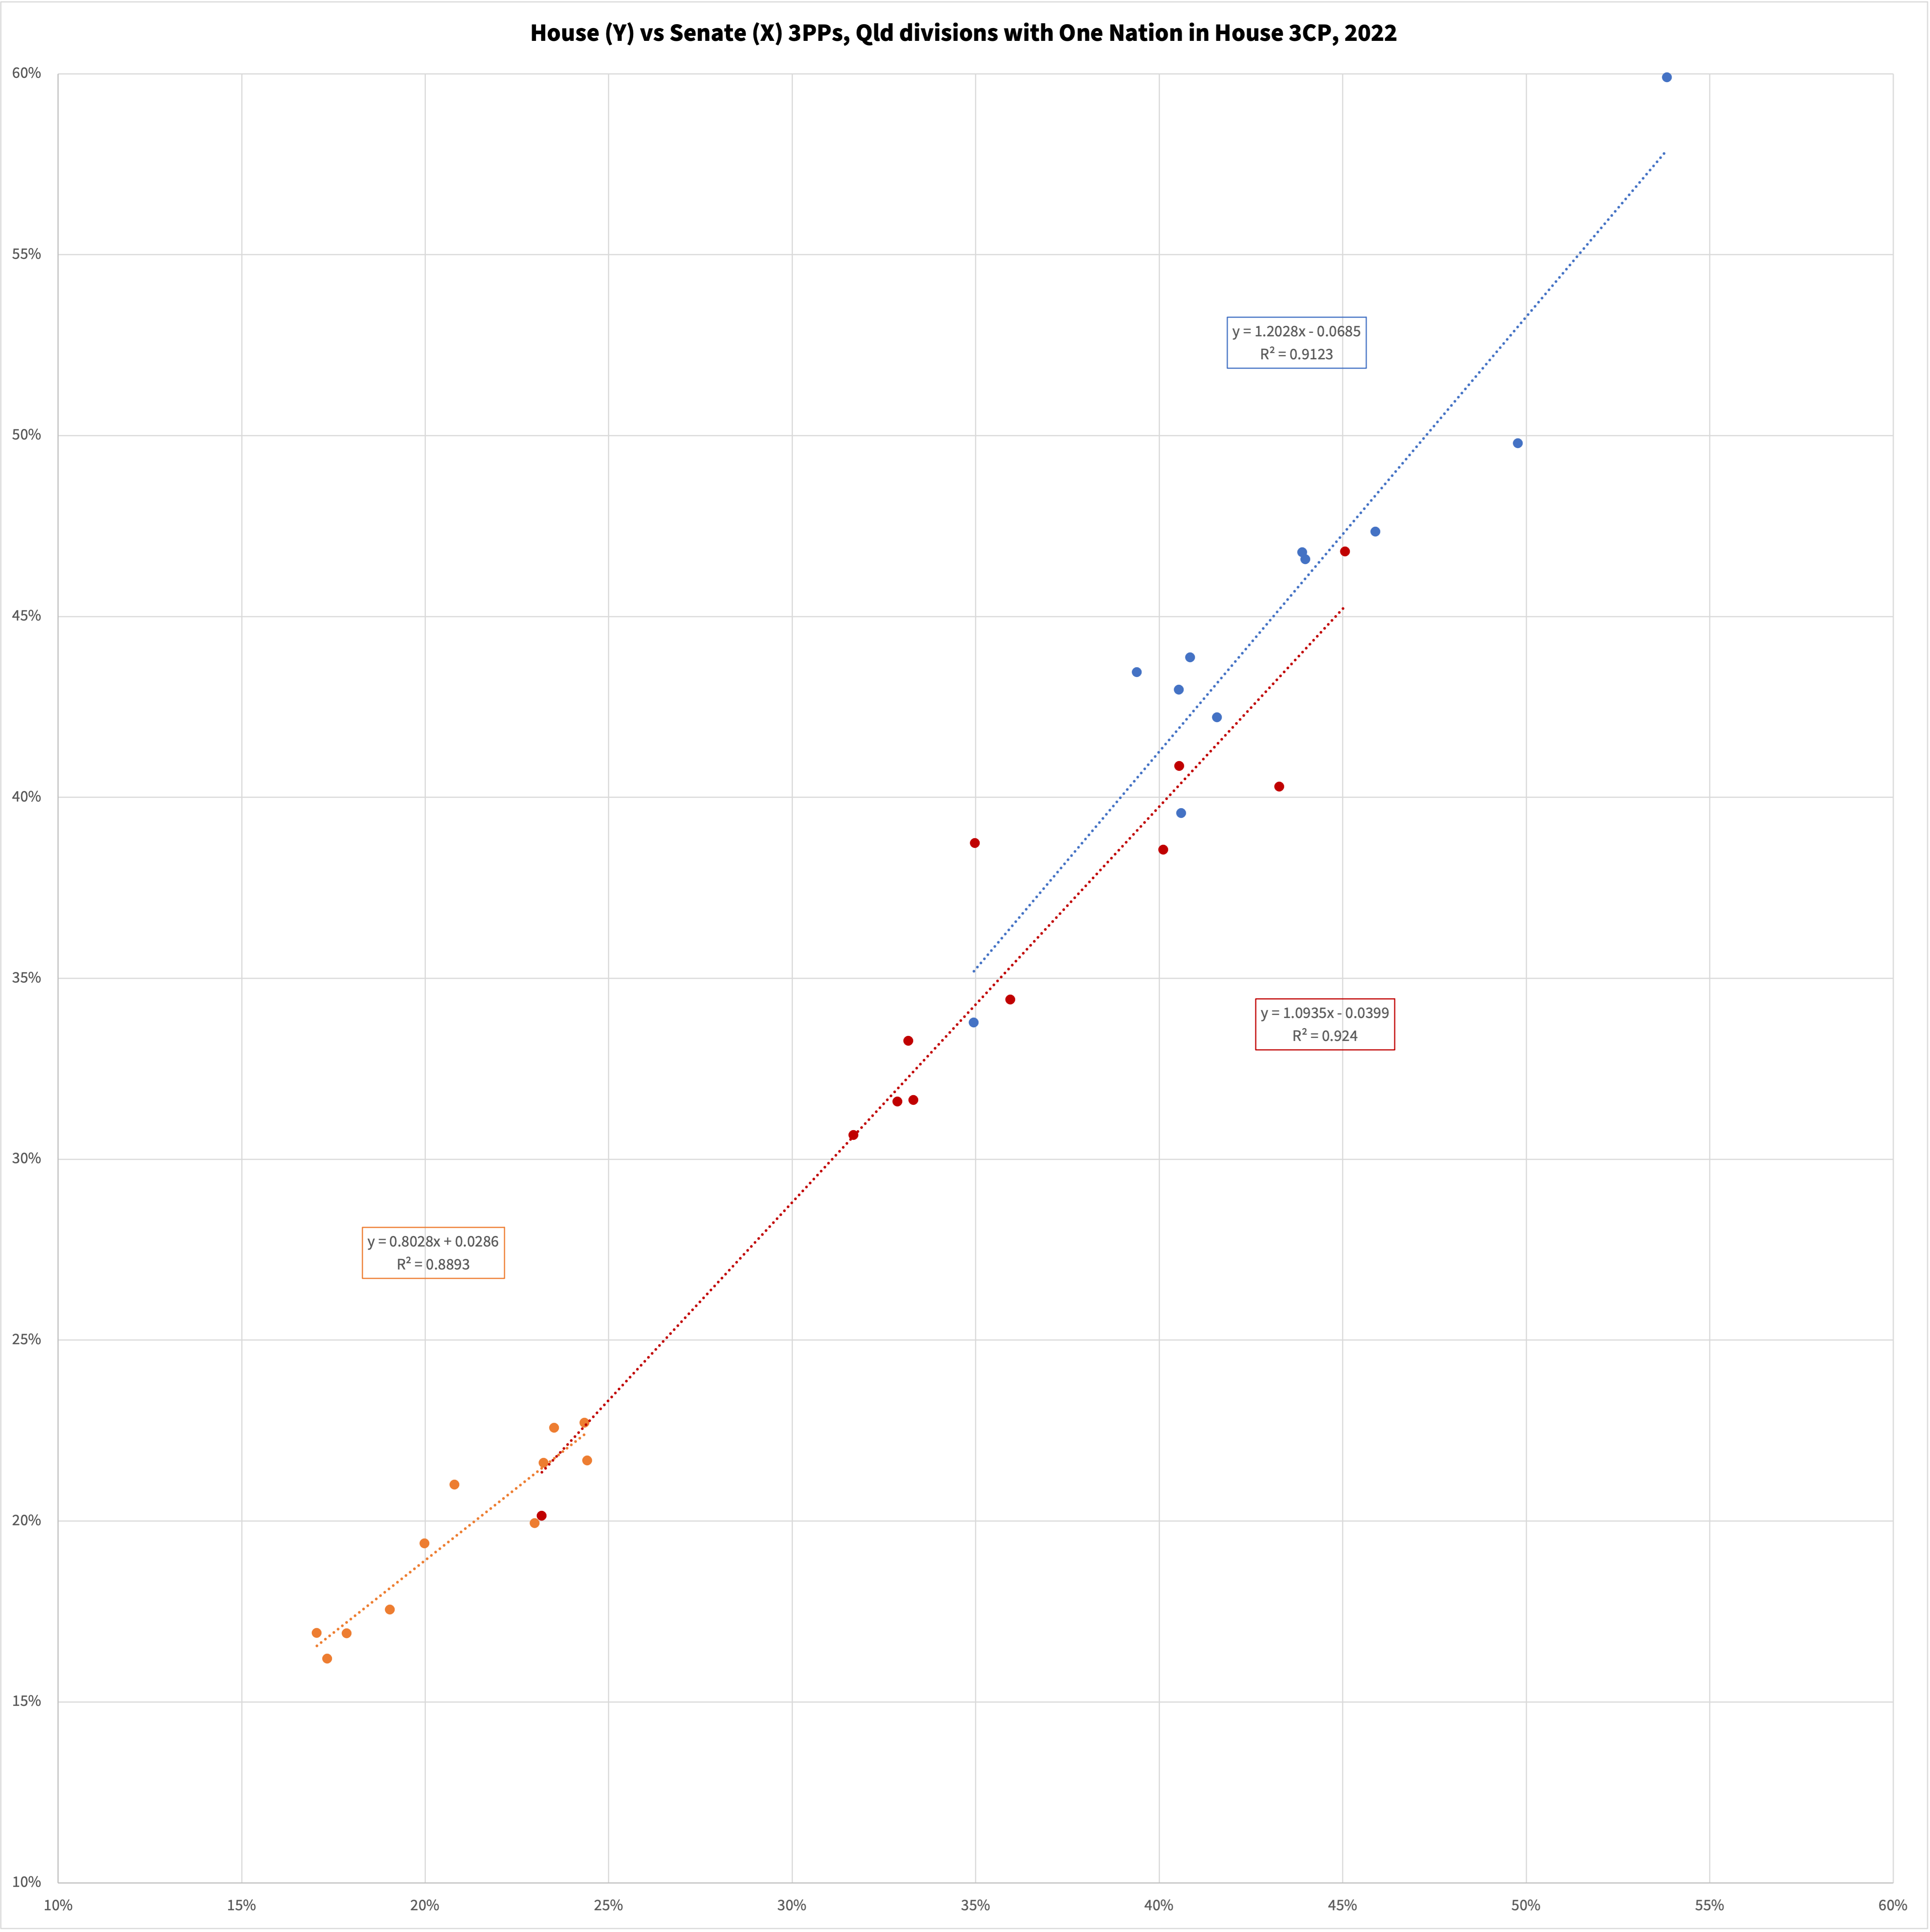
In the One Nation 3CP seats, we see a distinct
flattening of that party’s vote share with a trendline equation of
H = 0.8 * S + 0.03. This represents a particularly
inefficient distribution of the One Nation vote share for winning House
seats at this election - for a House vote share of 33.3% (guaranteed
top-two), a Senate vote share of almost 38% would be implied!
For Labor we also see a much less steep trendline compared to their
4PP results, flattened down to H = 1.09*S - 0.04. They
would perhaps prefer a somewhat steeper gradient here to make Blair
safer and put Leichhardt and Longman back into striking distance, but
really they need more votes in general. The LNP also have a flatter
trendline, though not as much (H = 1.2 * S - 0.07). They
too would probably prefer a shallower trendline here to pick up
Blair.