Modelling SA1-booth correspondences
Elections have geographic aspects: people live somewhere and often your neighbours are similar to you socio-economically. Further, both boundaries and polling places can differ across the three levels of government, and they change over time.
So it’s useful to have some sort of universal comparison geography like the SA1: a block of 200 to 800 people. SA1s are small enough to be rarely split by electorate boundaries, yet large enough to be a useful unit of analysis.
The Australian Electoral Commission publishes a correspondence file for each election mapping polling places to SA1s. This correspondence permits analyses that project booth-level results onto the SA1s of their voters - which could then be re-aggregated into different boundaries. Australian psephologists routinely calculate post-redistribution margins in this way. More speculatively, I previously used the Senate results from 2016 to predict the Qld state election in 2017 (as One Nation had re-emerged).
However, equivalent SA1-booth information is not generally published by state electoral commissions. As booths and boundaries differ between elections, we can’t just re-use the federal correspondences either.
But what is possible is some sort of probabilistic model. Intuitively, we’d expect people to be more likely go to a polling place that’s close(st) to where they live, and for them to be less likely to go to one that’s far away. However, rank-order on its own seems insufficient: if the closest and second-closest booths are near-equidistant, we’d expect a fairly even split.
We also might not want to use pure distance, because that’s tied a little too much to the specifics of the which polling places exist and to population density.
So I’ve performed an analysis using distance ratios instead:
I divide the distance D(P, X) from each SA1 P
to polling place X, by the distance from the SA1 to its
closest polling place C. So we have
R(P, X) = D(P, X) / D(P, C).
I also clamp the distances to be between 0.1 and 5000 km, so the ratios are in a reasonable range - and try to exclude special mobile booths, whose lack of location puts them at Null Island.
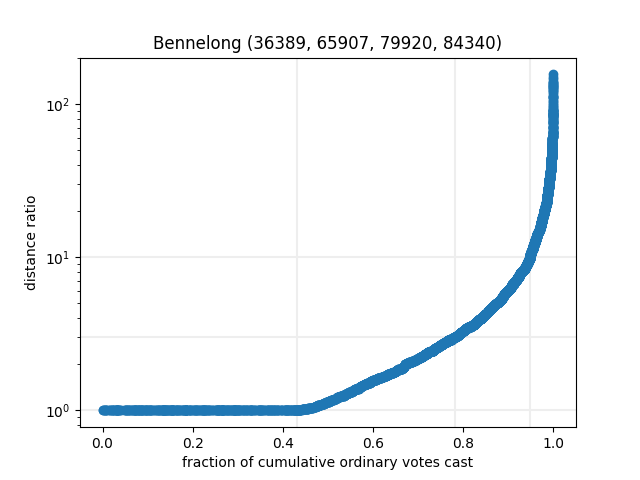
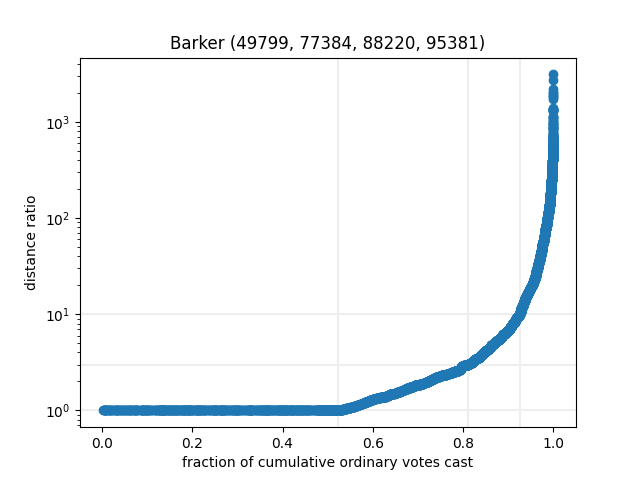
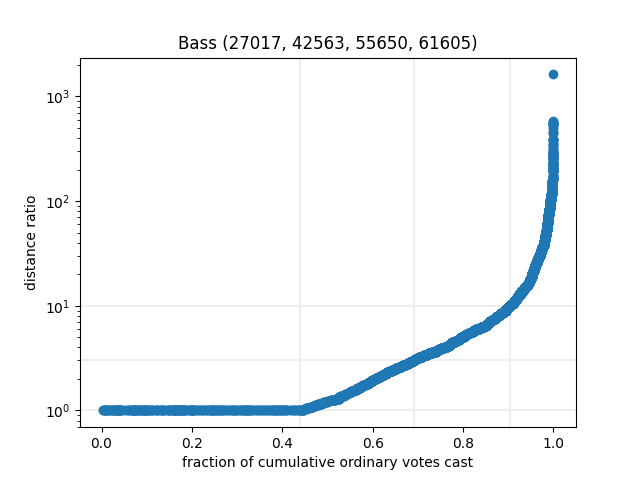
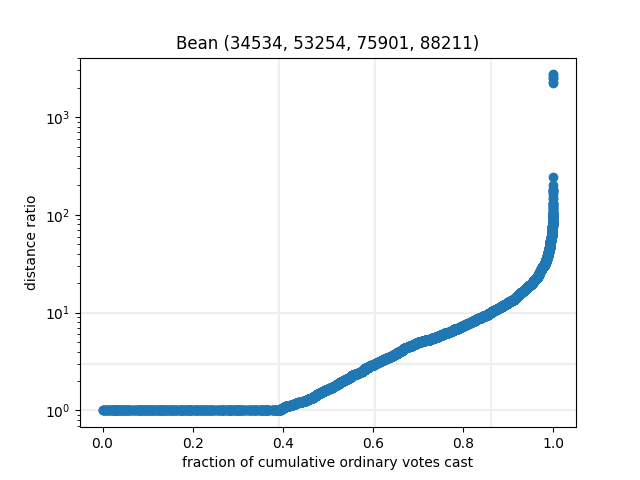
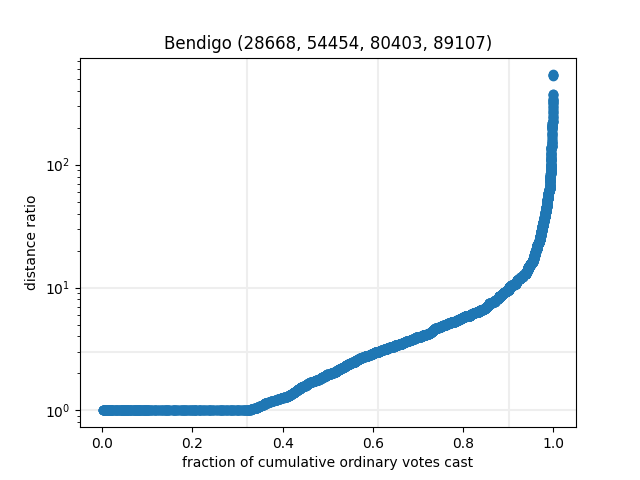
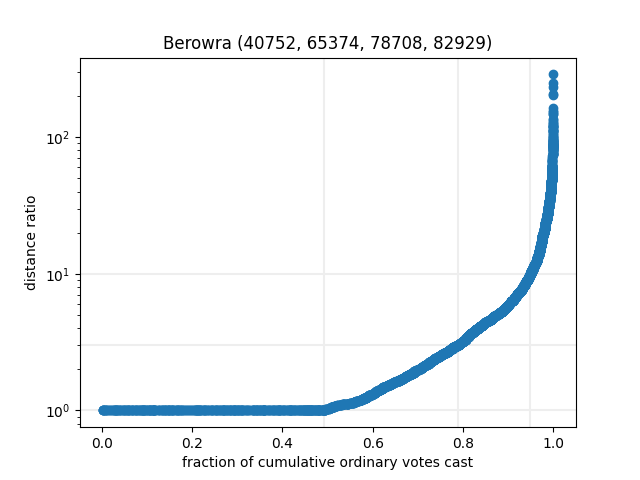
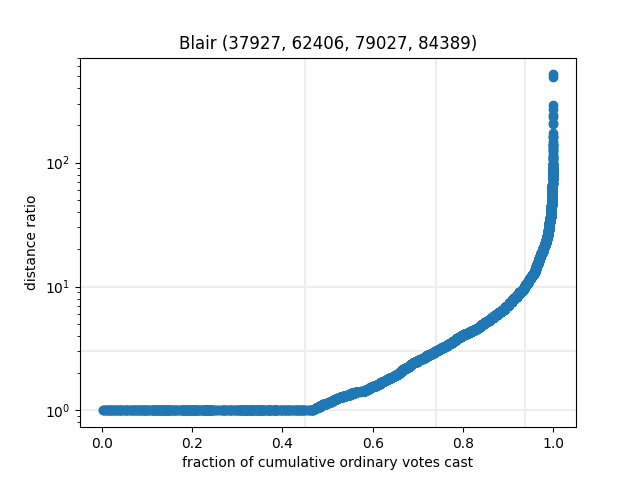
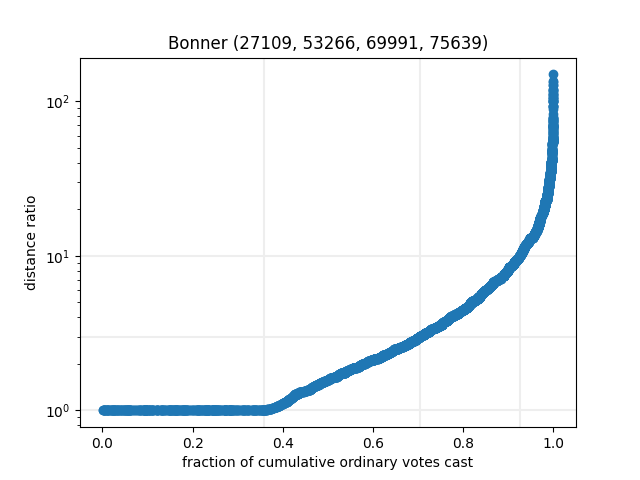
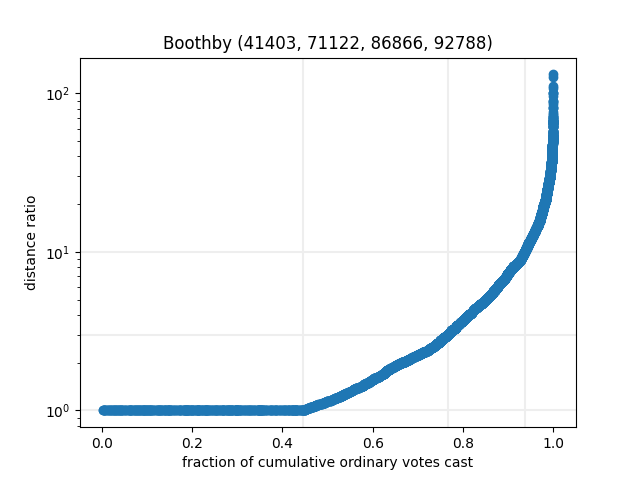
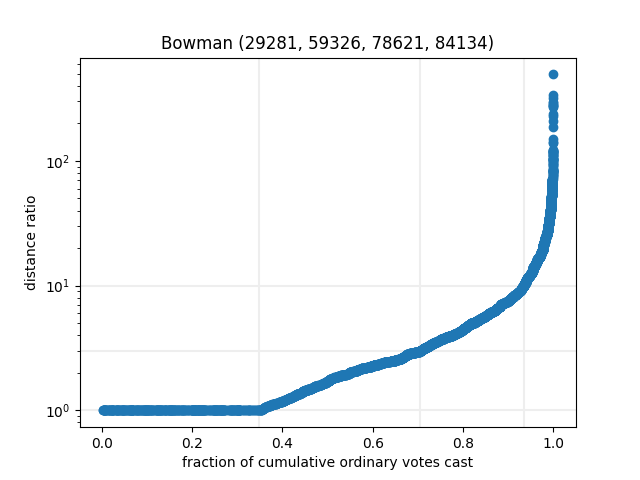
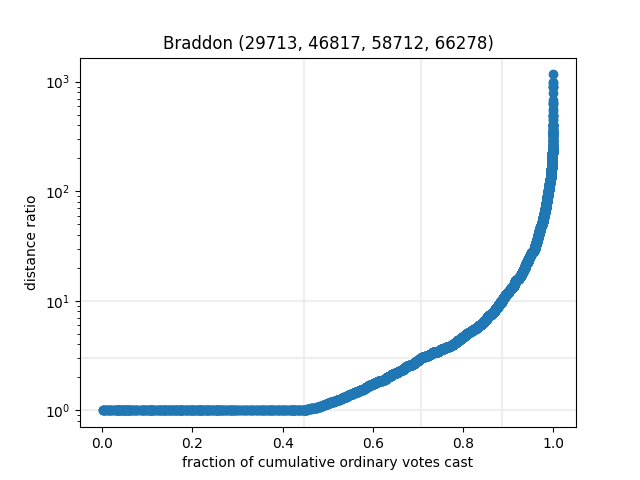
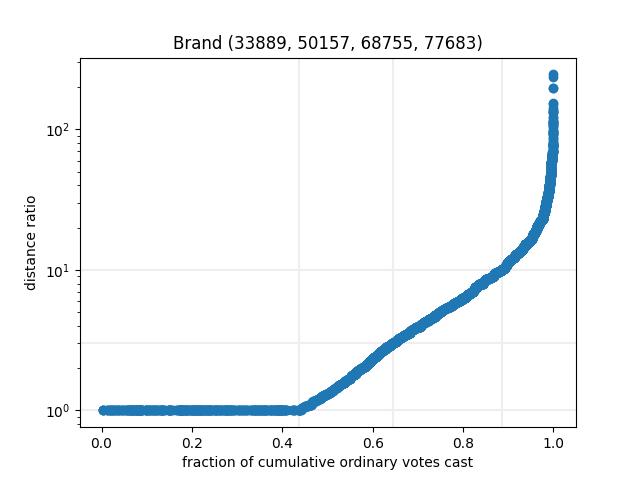
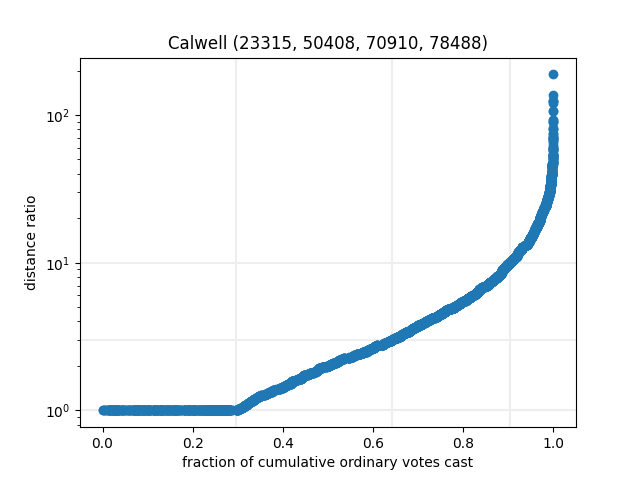
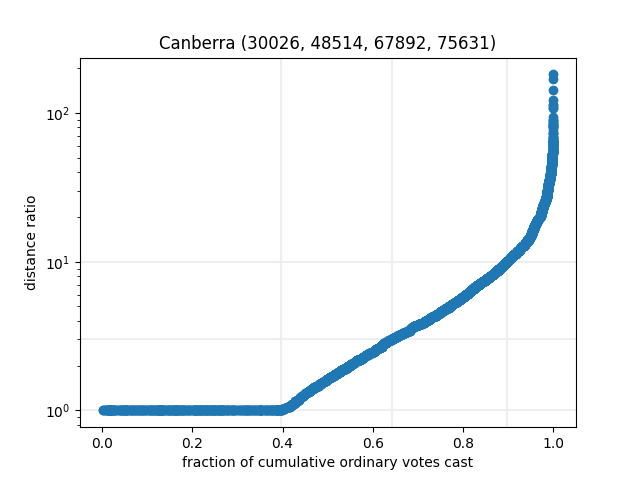
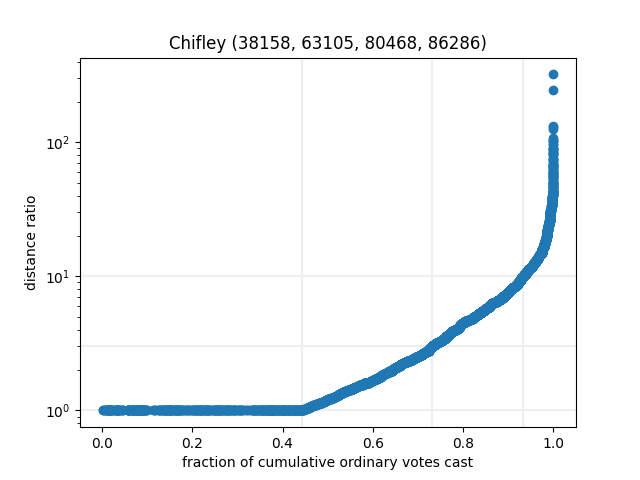
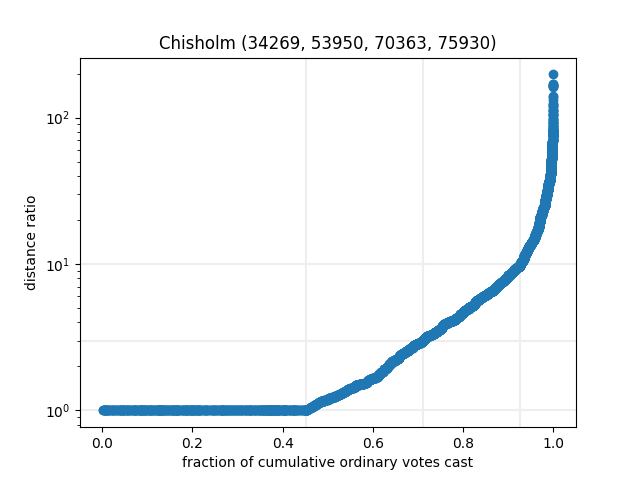
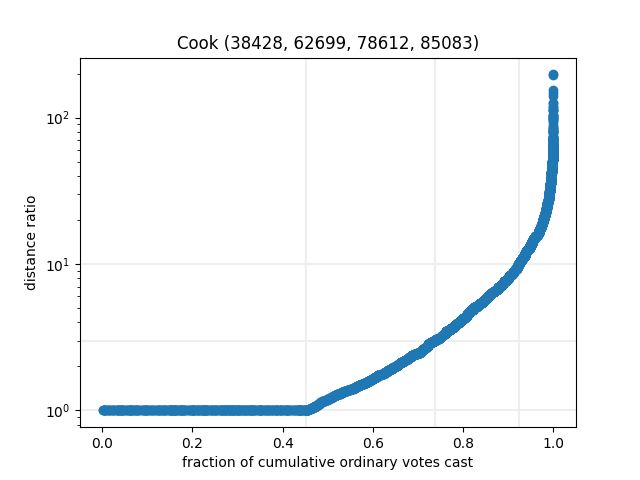
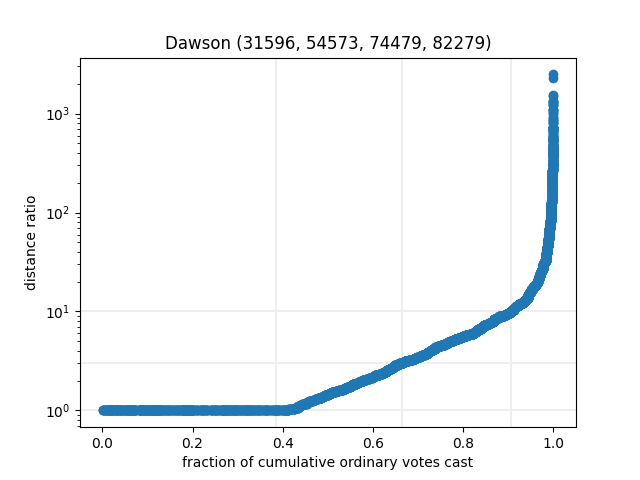
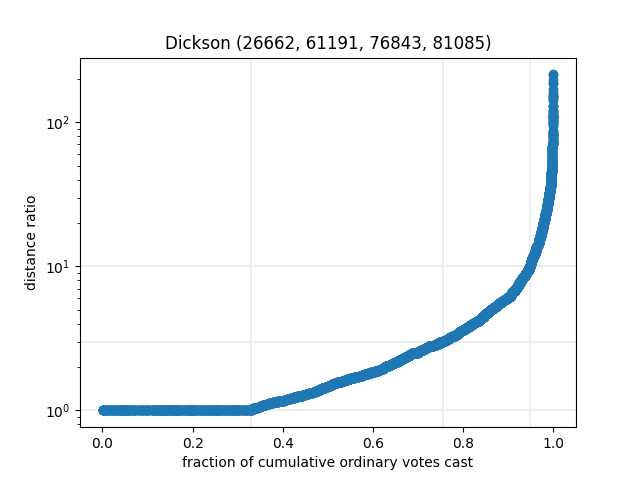
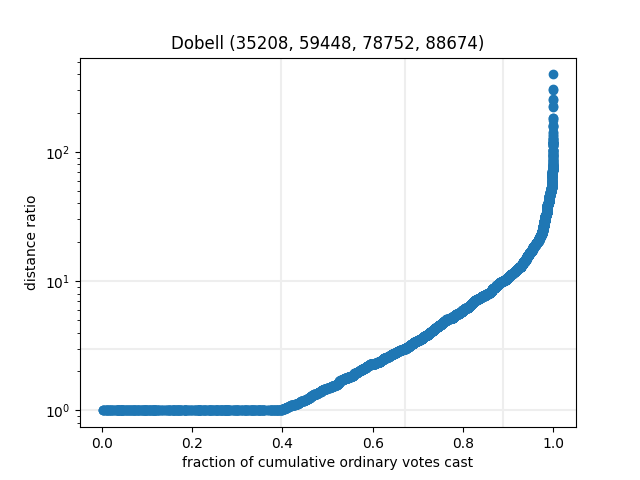
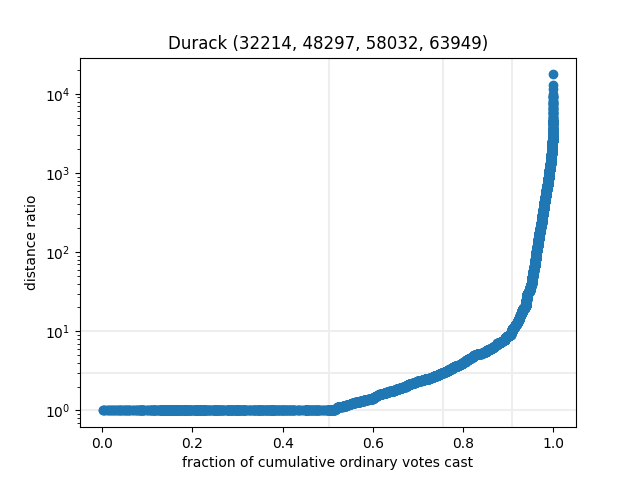
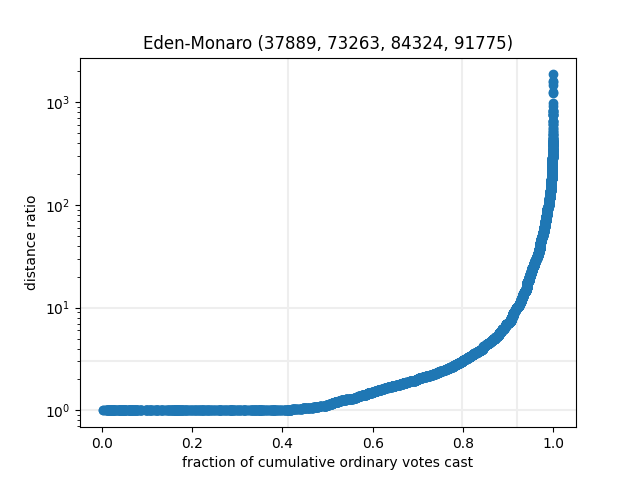
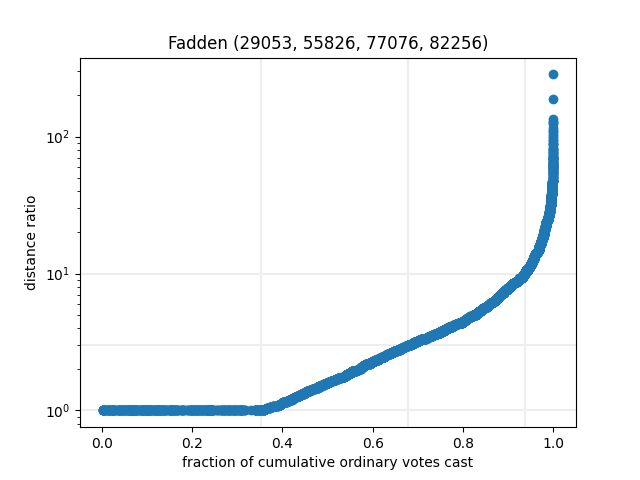
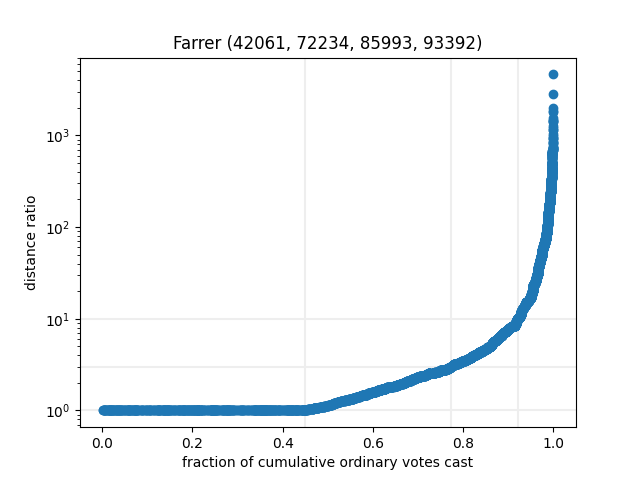
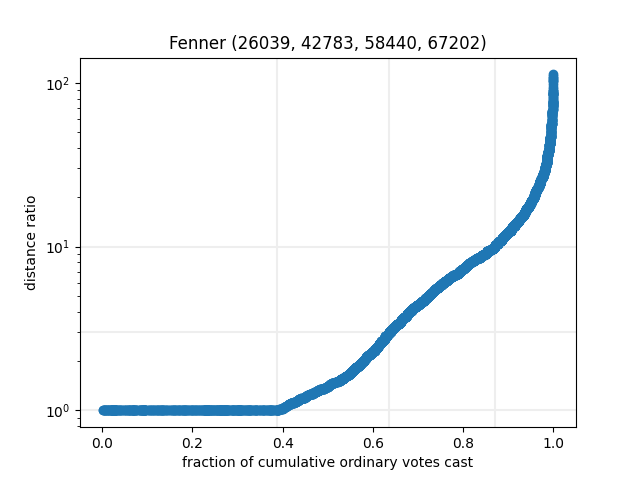
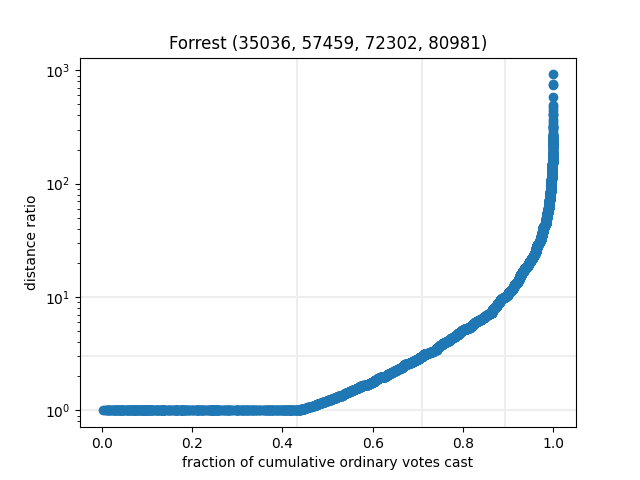
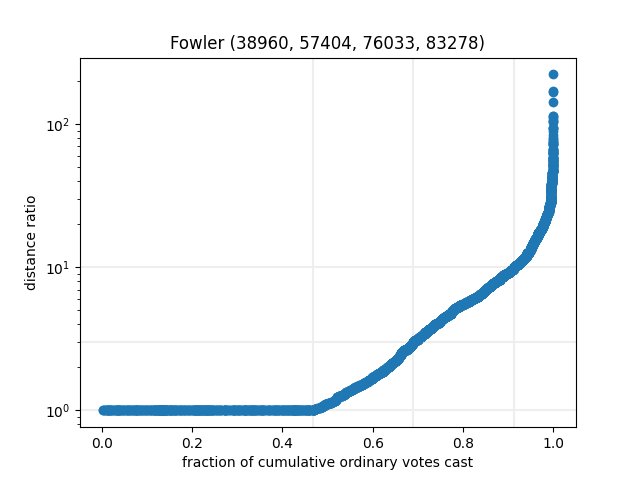
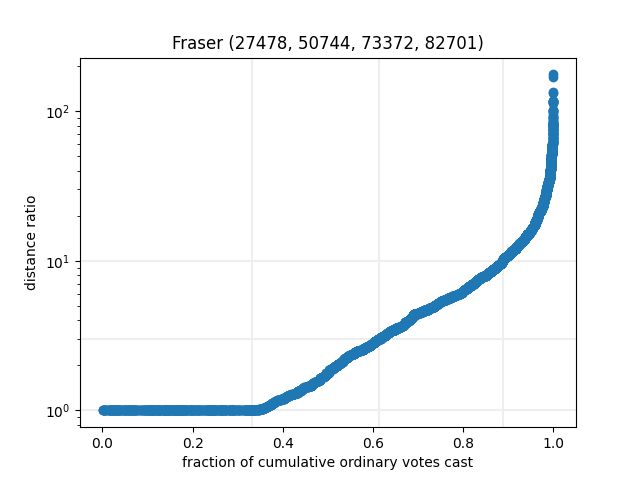
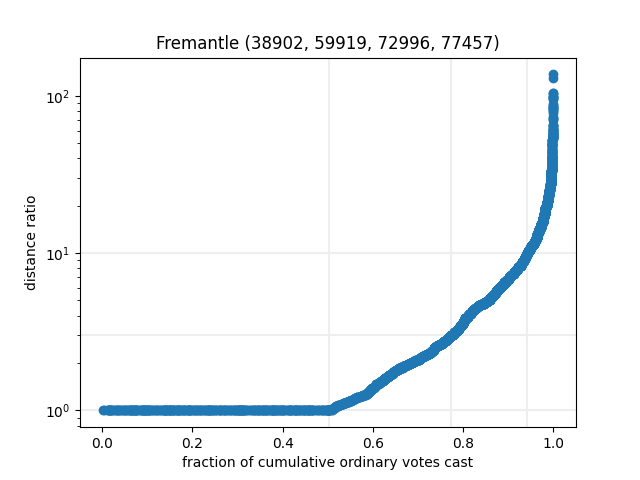
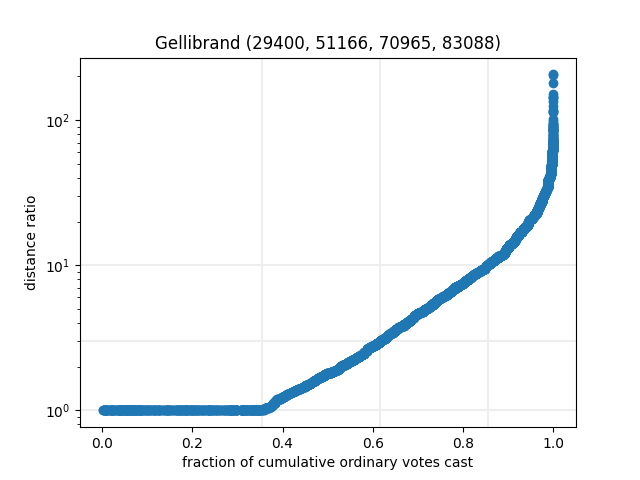
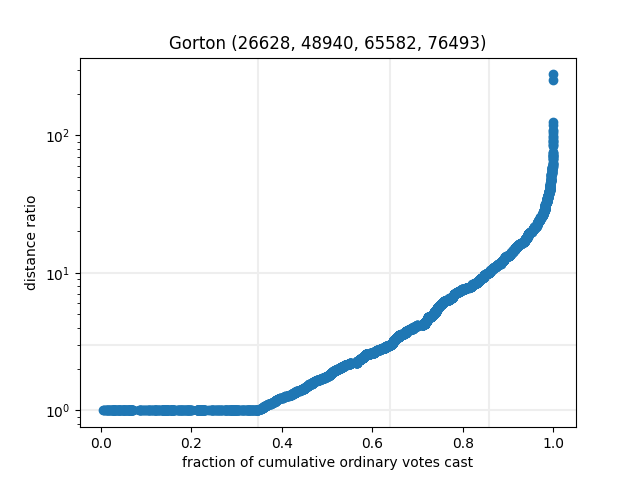
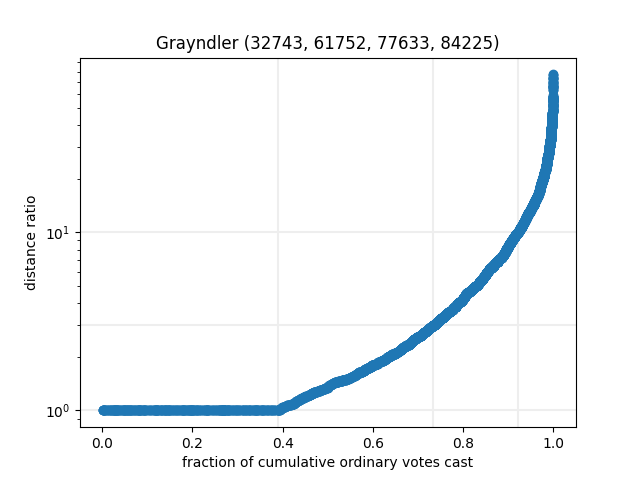
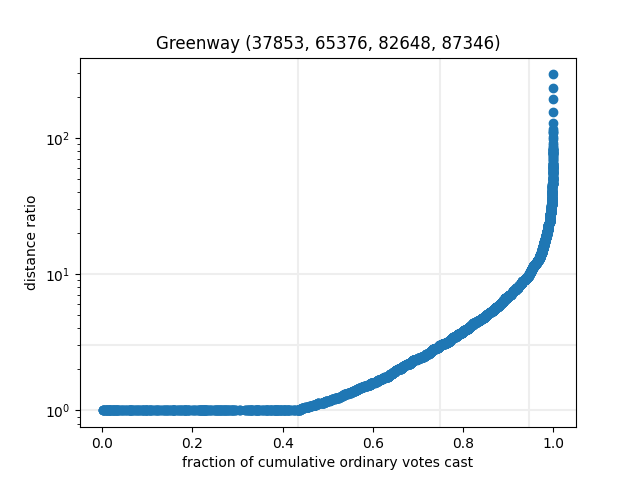
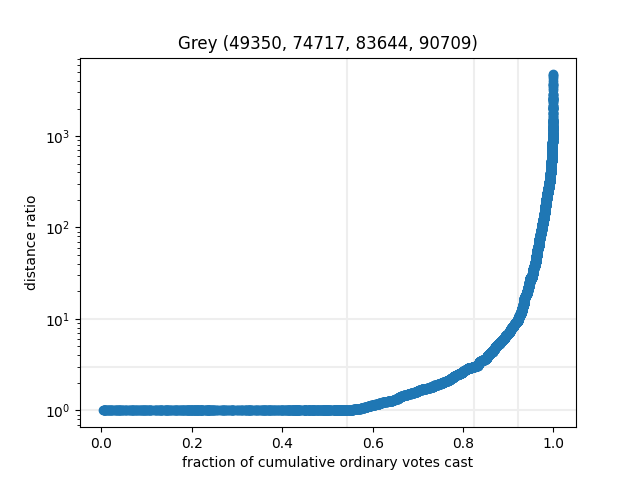
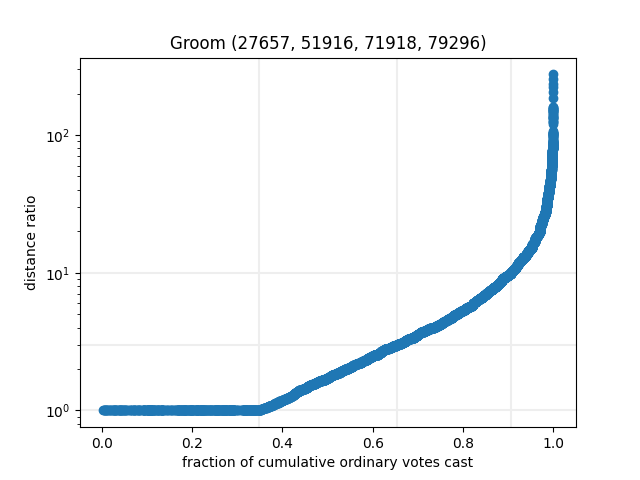
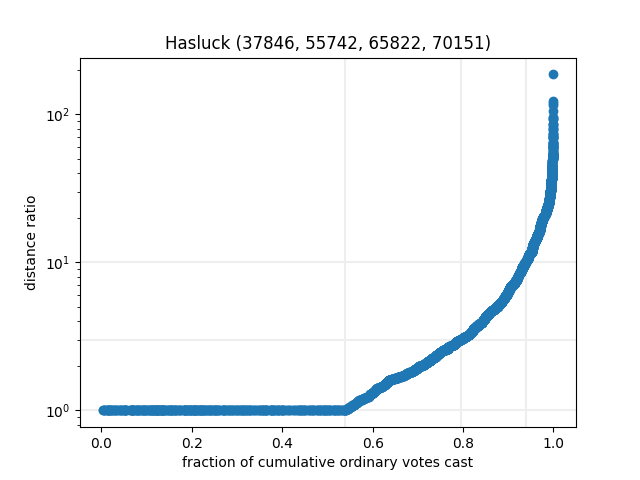
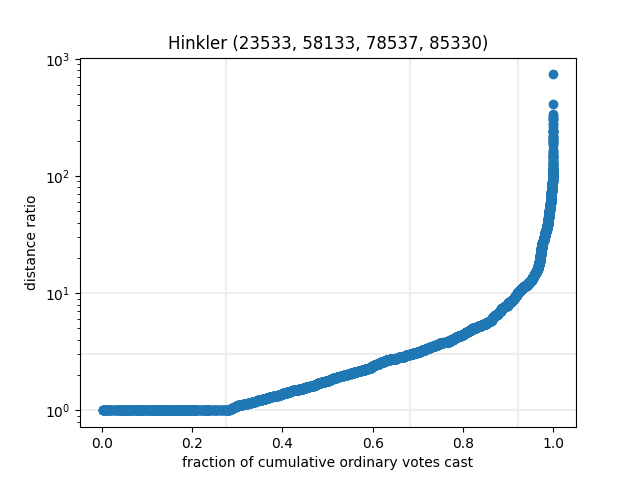
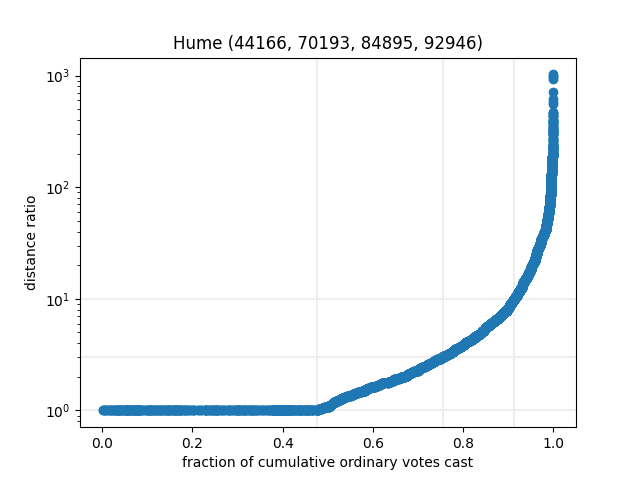
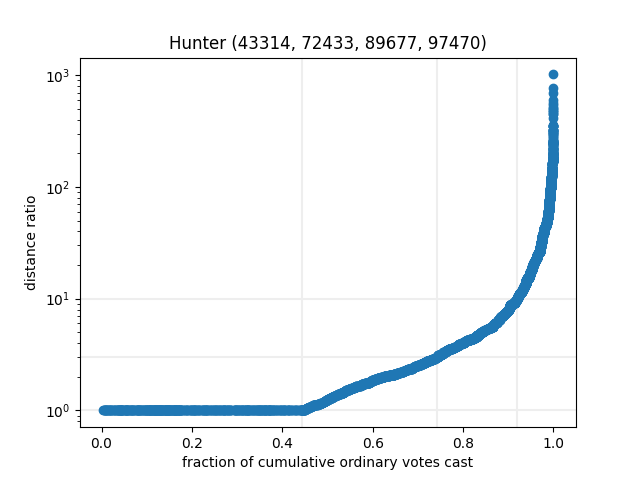
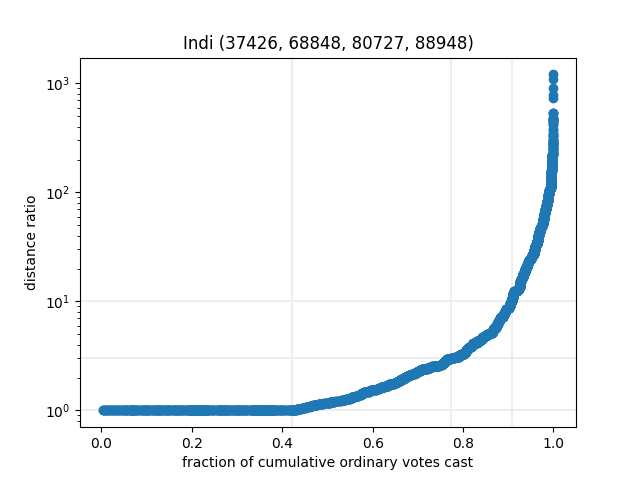
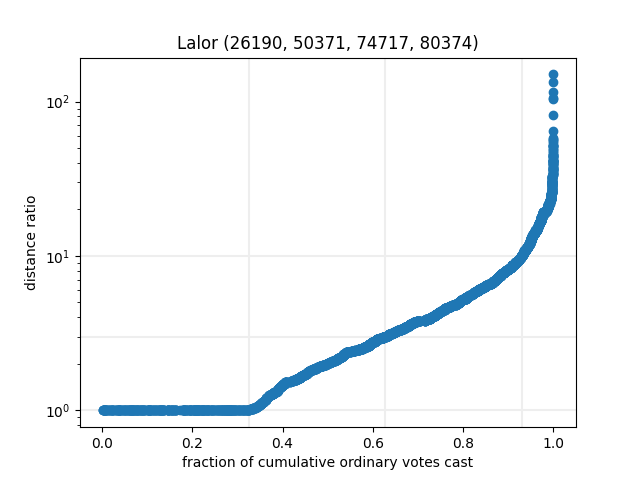
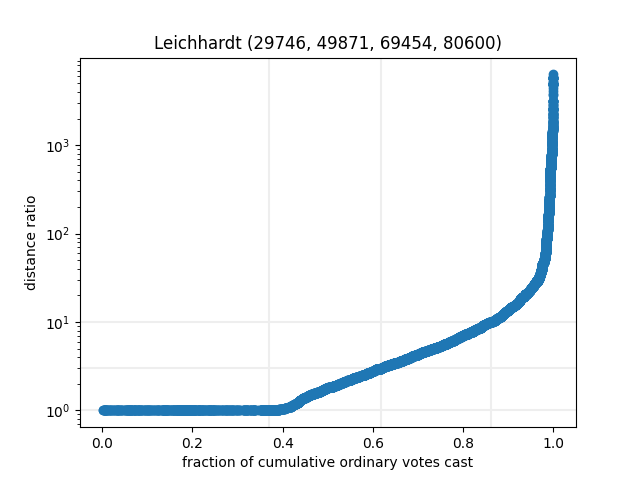
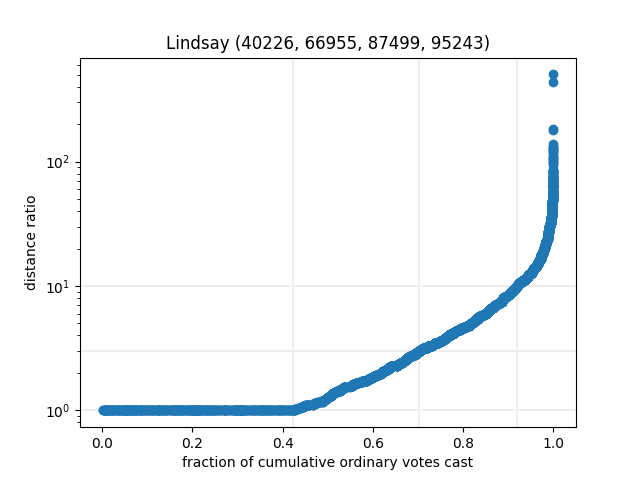
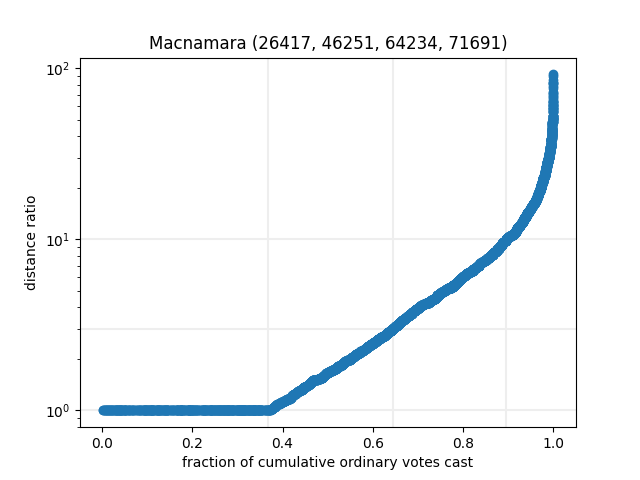
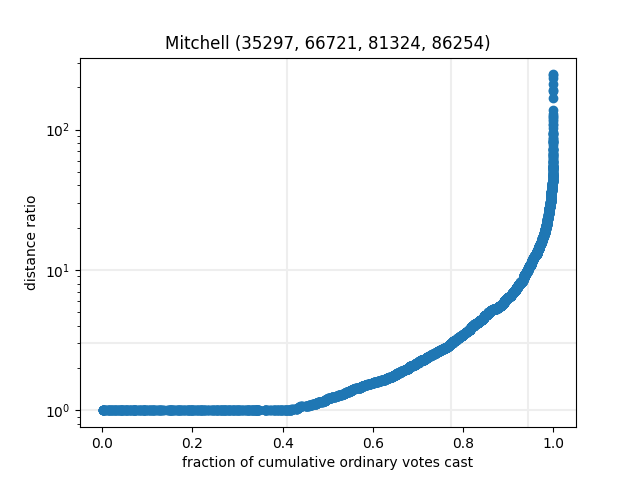
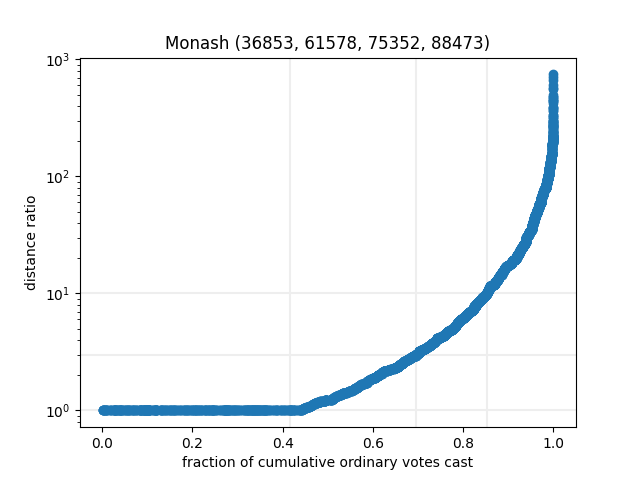
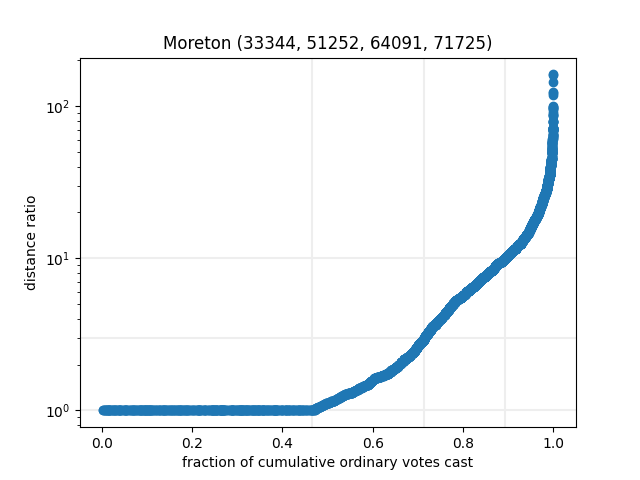
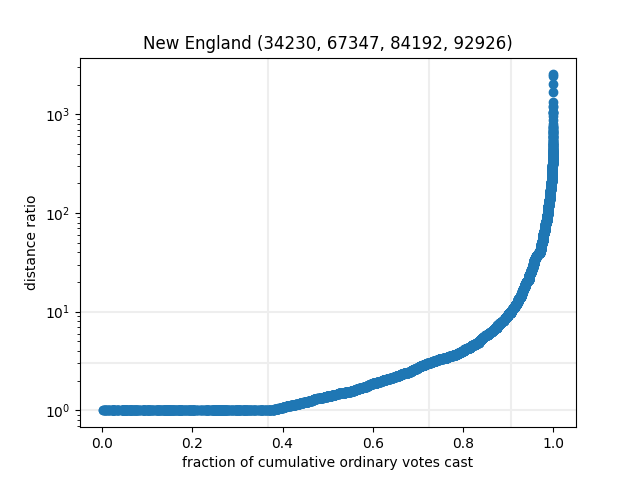
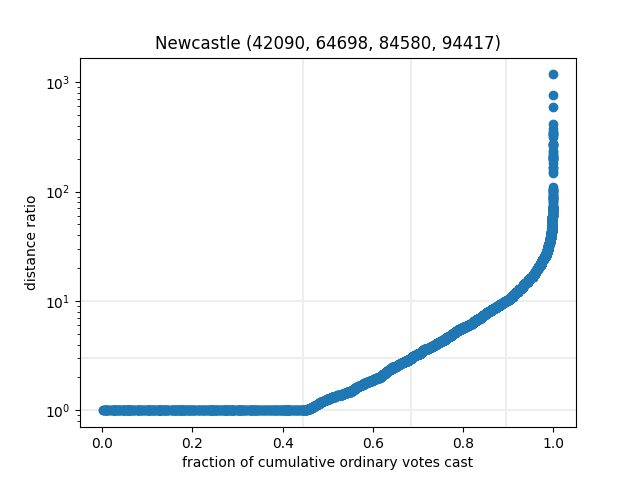
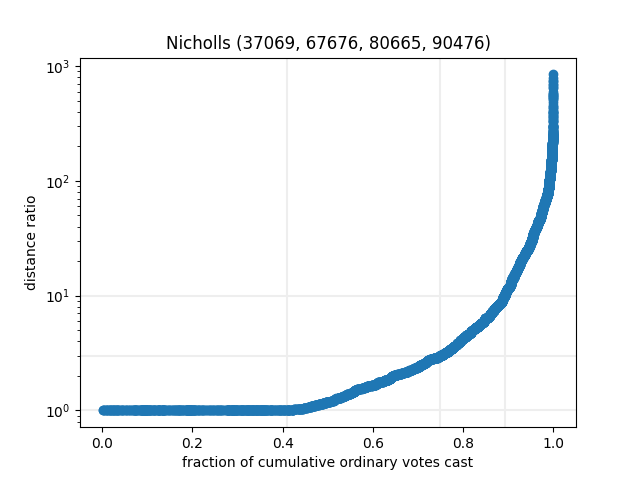
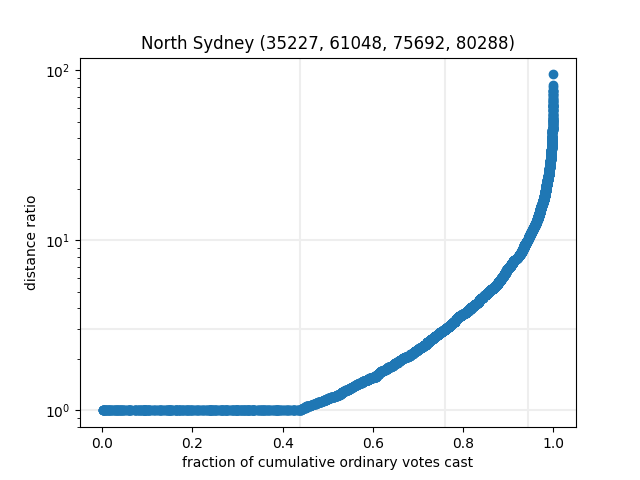
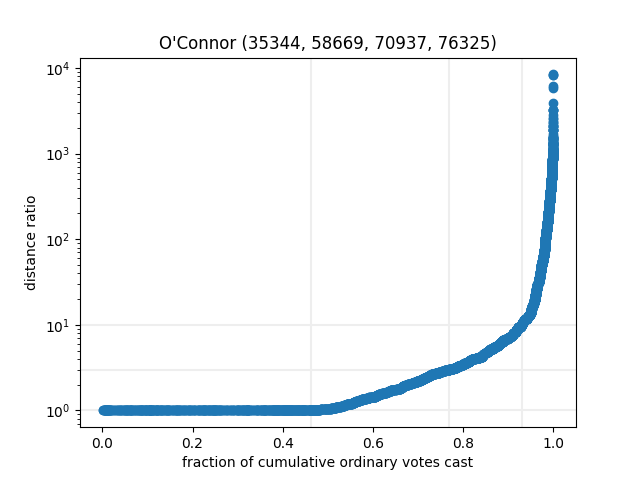
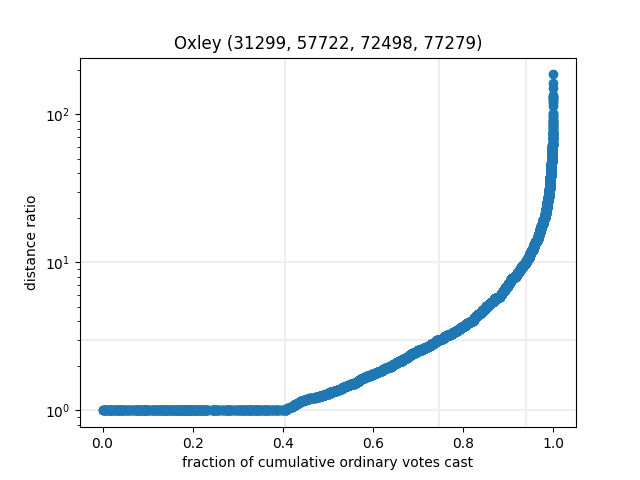
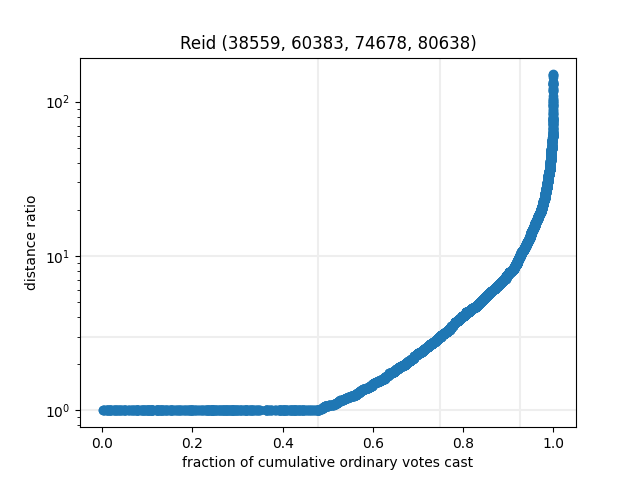
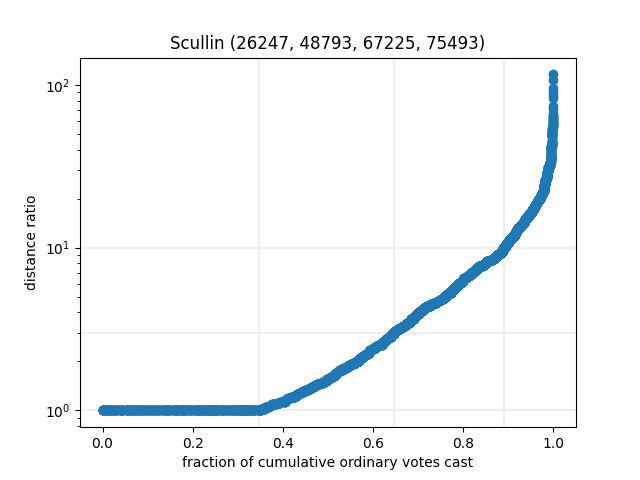
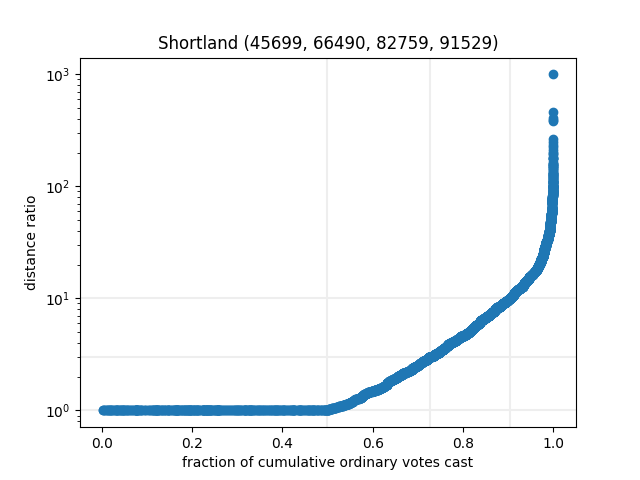
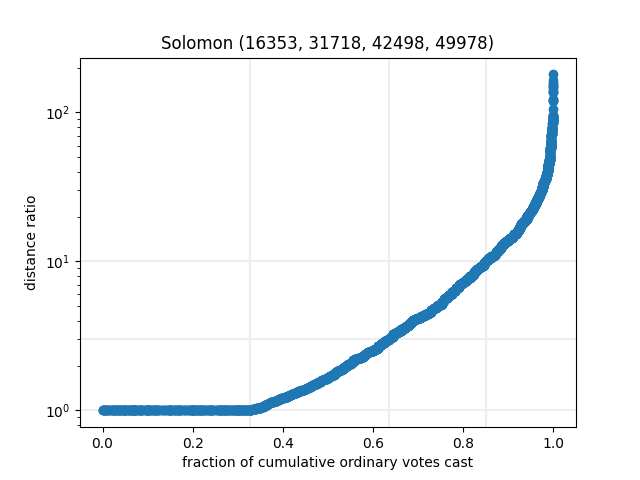
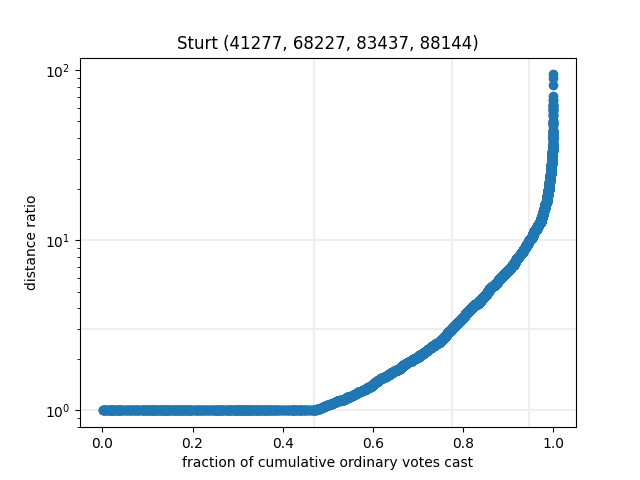
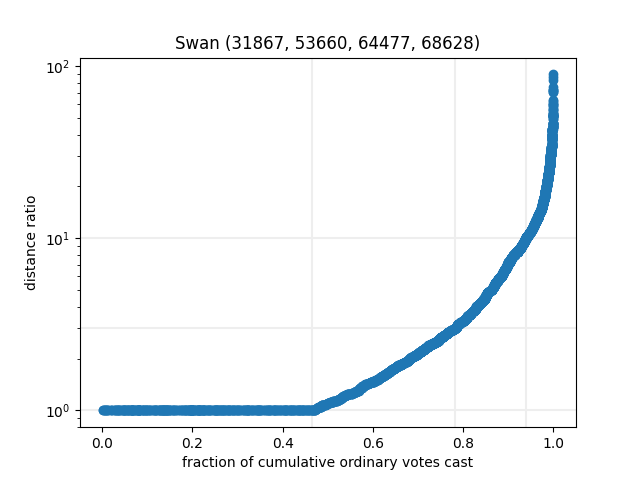
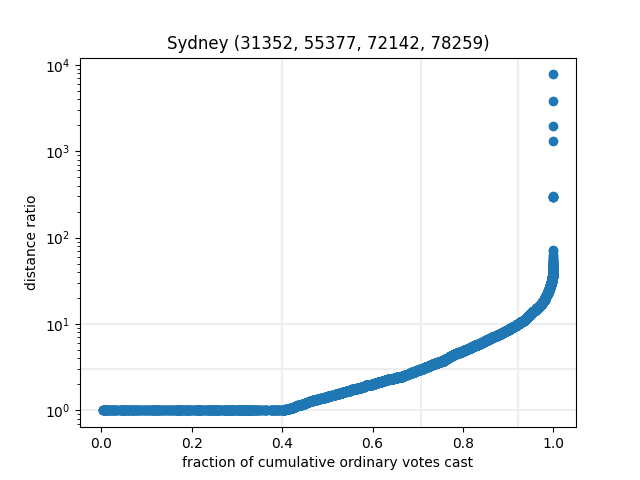
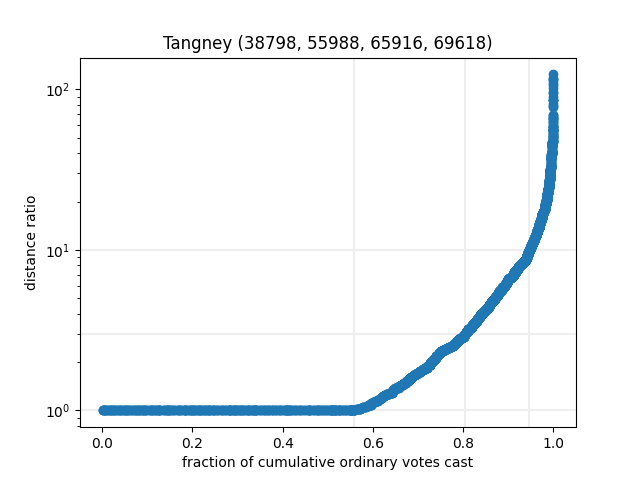
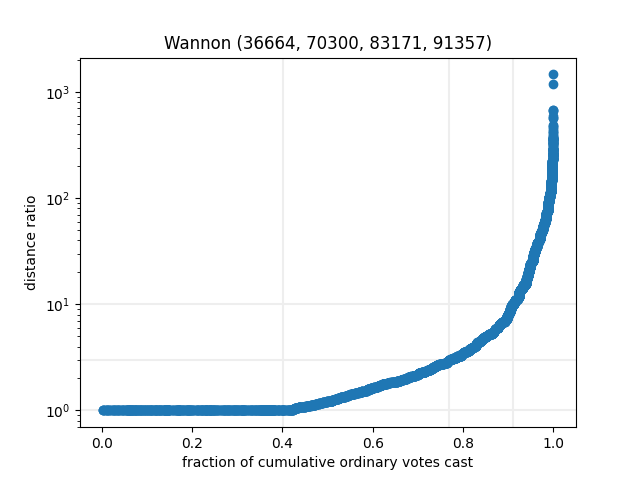
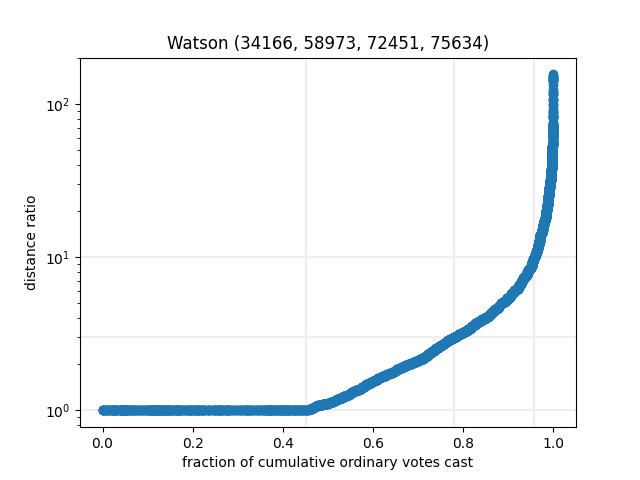
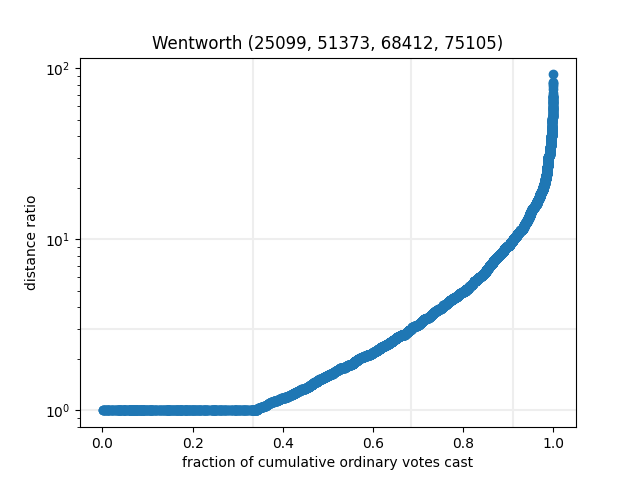
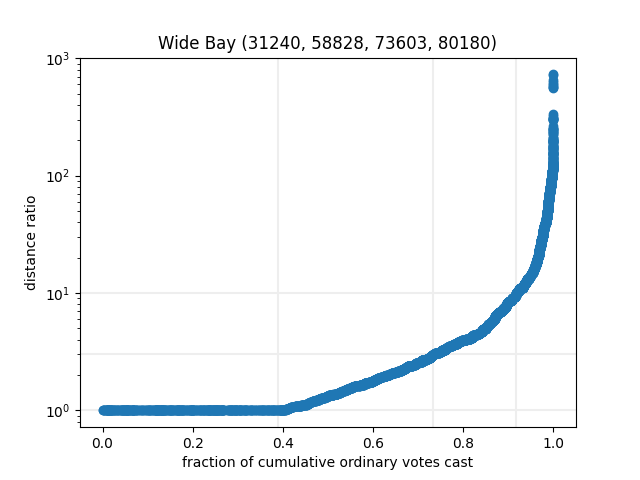
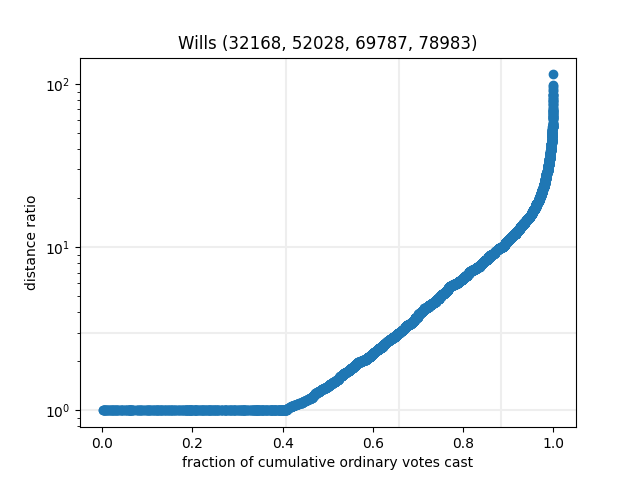
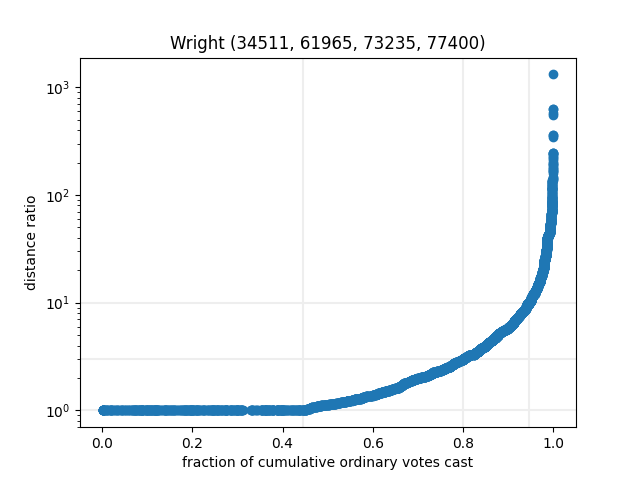
We then can sort every entry by distance ratio, lowest to highest, and plot by cumulative votes, for a sort of inverted cumulative distribution. It turns out that all the federal Divisions have similar-looking curves!
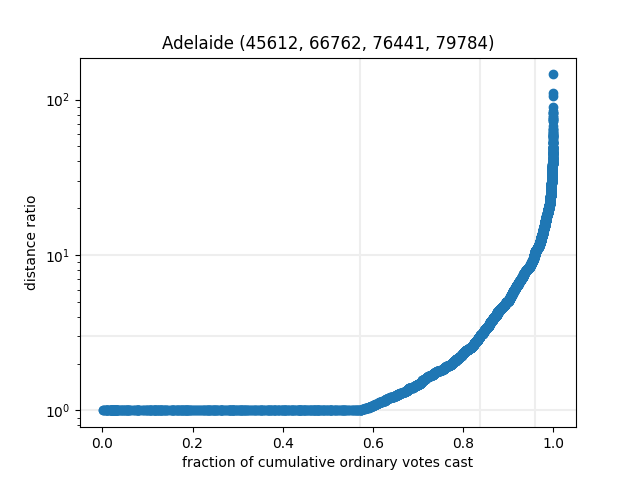
As you can see, I’ve broken out some figures in the title of these
graphs. They correspond to the vote total for 1x,
<=3x, <=10x distance ratios, and then
the total voters for that Division.

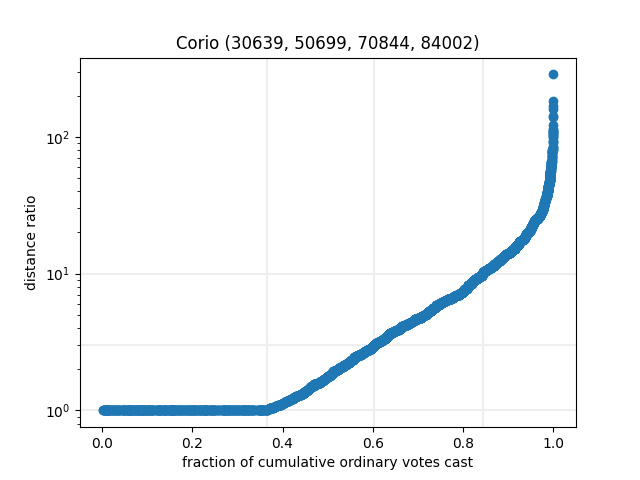
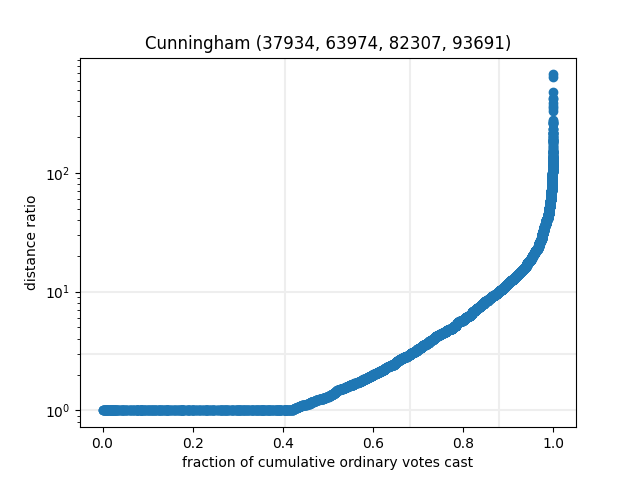
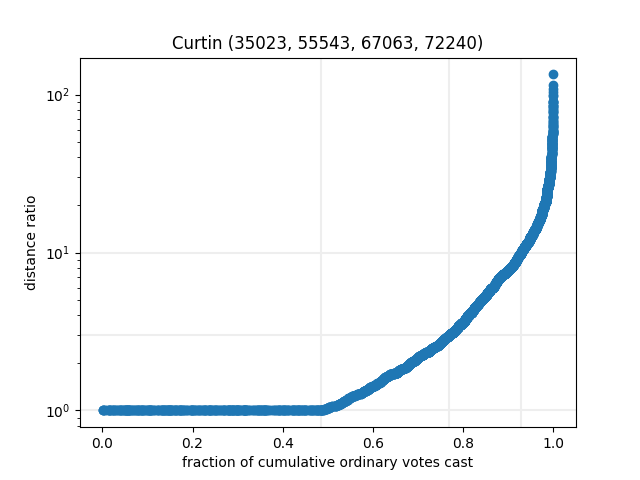
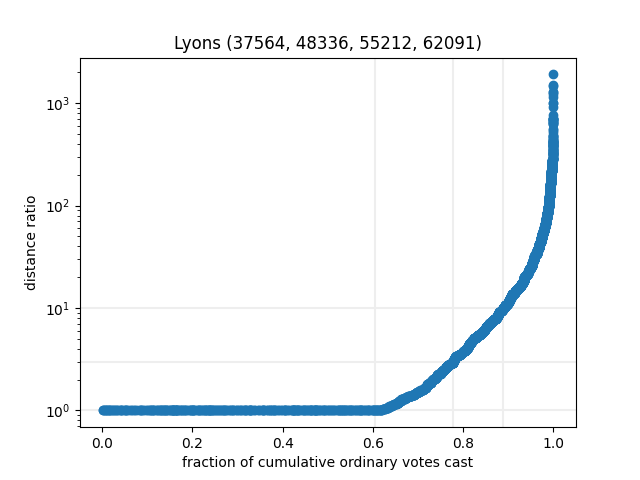
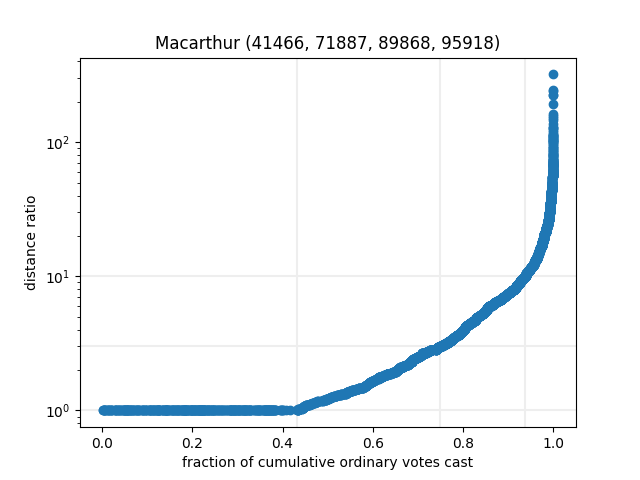
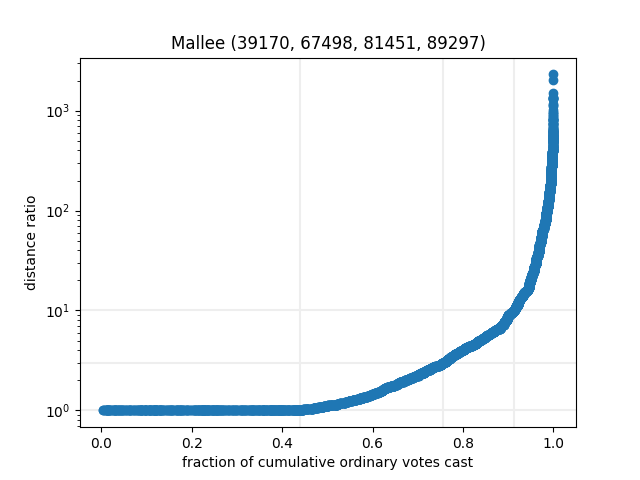
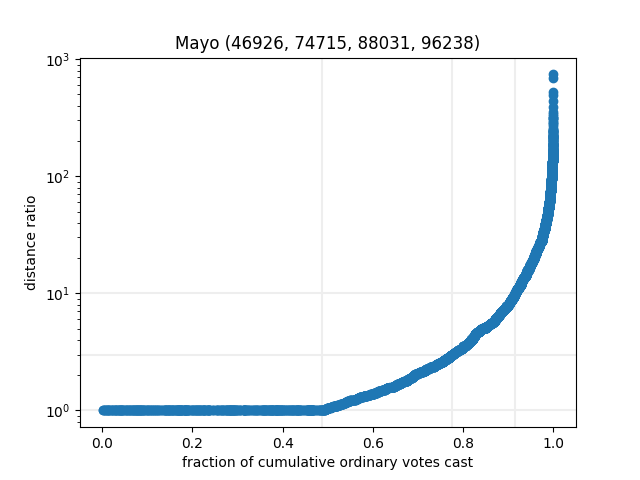
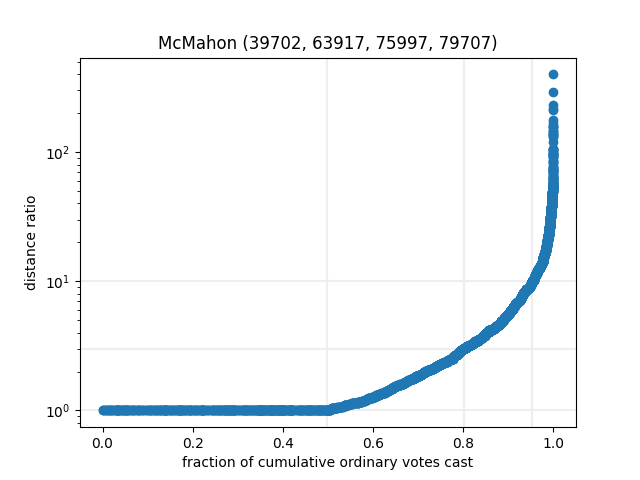
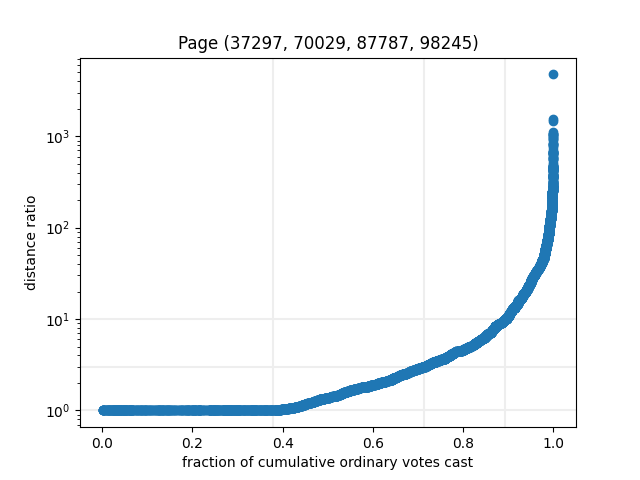
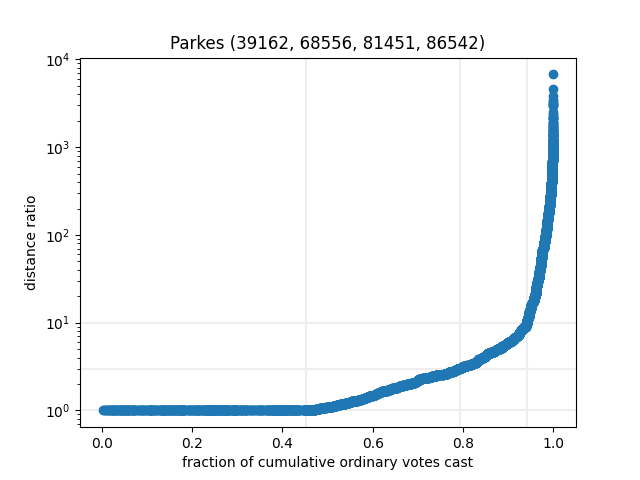
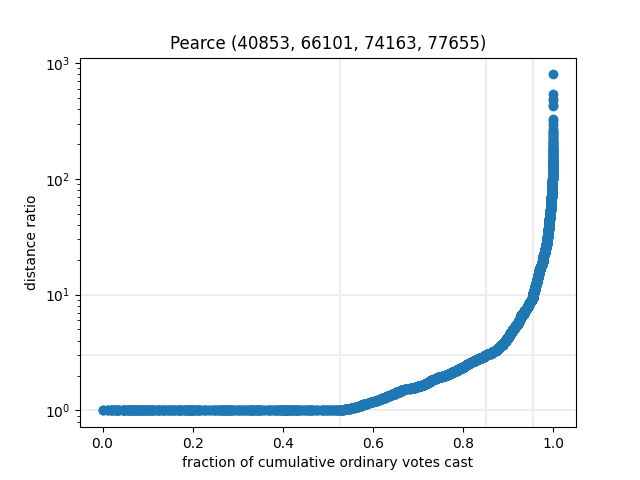
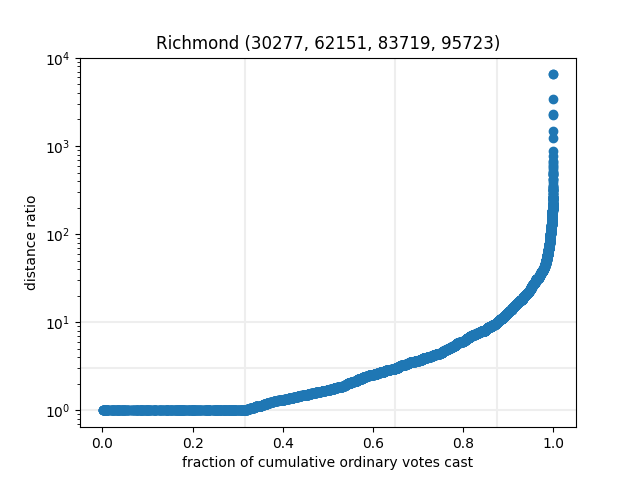
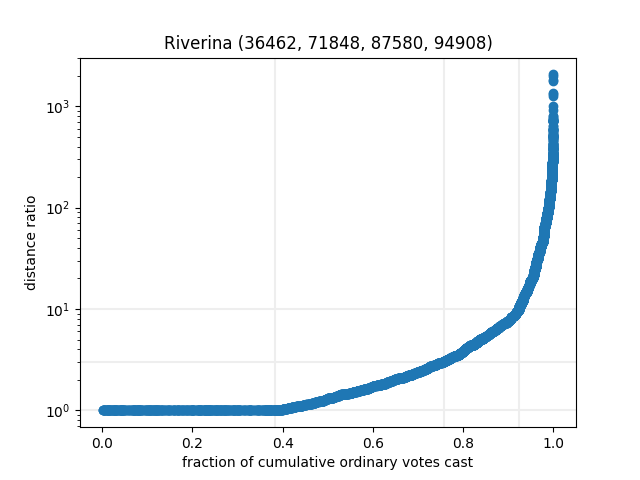
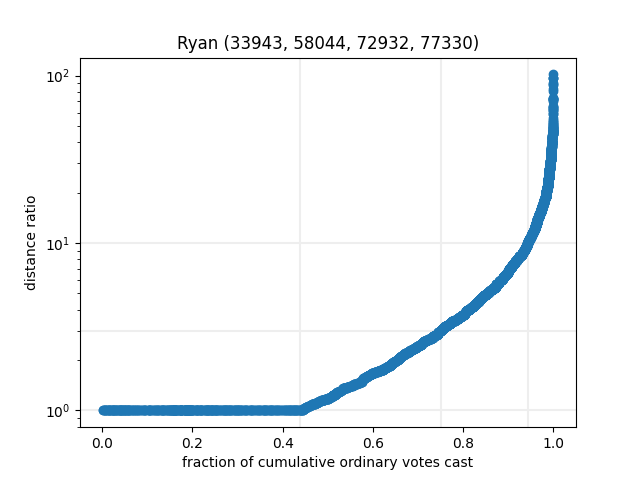
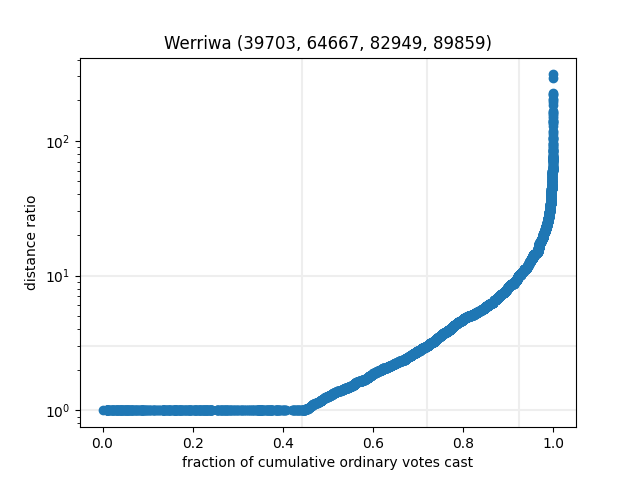
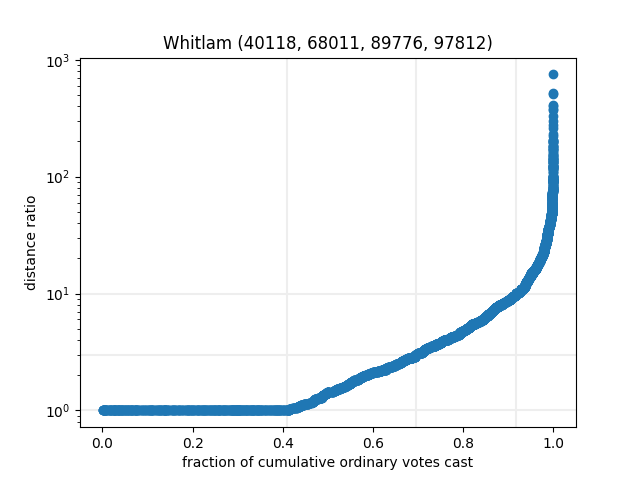
Those three are quite inner-city, so let’s look at some large remote ones too:
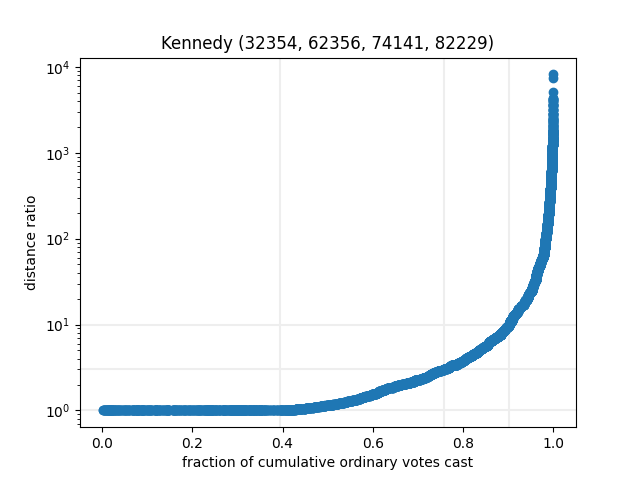
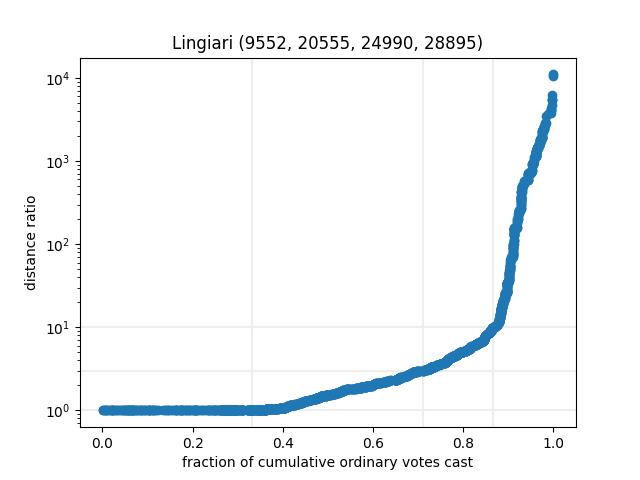
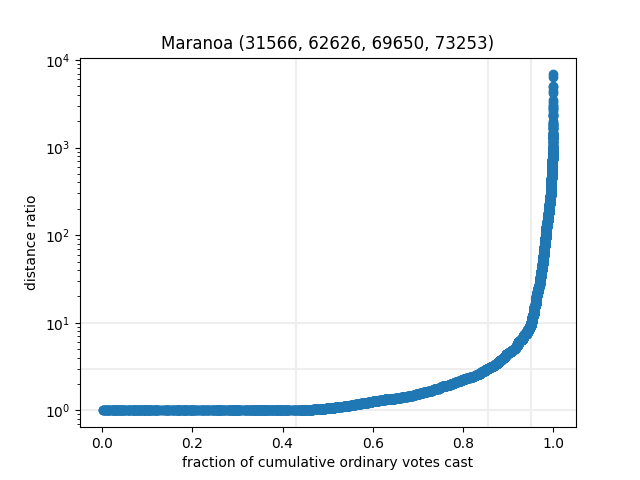
There’s a pretty consistent trend here: about 40% of people (who vote at a booth) do so at their closest available booth, and then another 50% vote at a booth that’s less than 10x as far away as their closest booth. Then about 10% vote much further away. (Or, despite my best efforts, some pseudo-booths that have missing coordinates — corresponding to 0°N, 0°E — have slipped in.)
We see (on a semi-log plot, at least) that there’s a pretty much straight line from the 1x maximum to the 3x mark, and often up to the 10x mark, before shooting up for the small percentage of people voting a long way away from home. So for any sensible set of booths, we can use the model to estimate where people from each SA1 will vote!
Downloads
- Database 32 MB compressed
- Analysis script
Table
All values for the 2019 Federal Election. Click on the division name for its graph, or on a heading to sort by that column.
| Division | <=1x | <=3x | <=10x |
|---|---|---|---|
| Adelaide | 57% | 84% | 96% |
| Aston | 39% | 69% | 95% |
| Ballarat | 34% | 64% | 89% |
| Banks | 47% | 76% | 94% |
| Barker | 52% | 81% | 92% |
| Barton | 41% | 76% | 95% |
| Bass | 44% | 69% | 90% |
| Bean | 39% | 60% | 86% |
| Bendigo | 32% | 61% | 90% |
| Bennelong | 43% | 78% | 95% |
| Berowra | 49% | 79% | 95% |
| Blair | 45% | 74% | 94% |
| Blaxland | 43% | 76% | 94% |
| Bonner | 36% | 70% | 93% |
| Boothby | 45% | 77% | 94% |
| Bowman | 35% | 71% | 93% |
| Braddon | 45% | 71% | 89% |
| Bradfield | 44% | 77% | 94% |
| Brand | 44% | 65% | 89% |
| Brisbane | 42% | 72% | 92% |
| Bruce | 40% | 65% | 90% |
| Burt | 51% | 77% | 93% |
| Calare | 34% | 74% | 93% |
| Calwell | 30% | 64% | 90% |
| Canberra | 40% | 64% | 90% |
| Canning | 37% | 69% | 93% |
| Capricornia | 36% | 69% | 90% |
| Casey | 42% | 67% | 89% |
| Chifley | 44% | 73% | 93% |
| Chisholm | 45% | 71% | 93% |
| Clark | 42% | 72% | 93% |
| Cook | 45% | 74% | 92% |
| Cooper | 40% | 68% | 90% |
| Corangamite | 40% | 62% | 81% |
| Corio | 36% | 60% | 84% |
| Cowan | 56% | 82% | 95% |
| Cowper | 34% | 67% | 89% |
| Cunningham | 40% | 68% | 88% |
| Curtin | 48% | 77% | 93% |
| Dawson | 38% | 66% | 91% |
| Deakin | 43% | 71% | 93% |
| Dickson | 33% | 75% | 95% |
| Dobell | 40% | 67% | 89% |
| Dunkley | 36% | 67% | 93% |
| Durack | 50% | 76% | 91% |
| Eden-Monaro | 41% | 80% | 92% |
| Fadden | 35% | 68% | 94% |
| Fairfax | 35% | 67% | 93% |
| Farrer | 45% | 77% | 92% |
| Fenner | 39% | 64% | 87% |
| Fisher | 35% | 66% | 92% |
| Flinders | 30% | 67% | 91% |
| Flynn | 41% | 71% | 90% |
| Forde | 41% | 74% | 95% |
| Forrest | 43% | 71% | 89% |
| Fowler | 47% | 69% | 91% |
| Franklin | 54% | 77% | 92% |
| Fraser | 33% | 61% | 89% |
| Fremantle | 50% | 77% | 94% |
| Gellibrand | 35% | 62% | 85% |
| Gilmore | 37% | 68% | 85% |
| Gippsland | 36% | 65% | 85% |
| Goldstein | 39% | 65% | 88% |
| Gorton | 35% | 64% | 86% |
| Grayndler | 39% | 73% | 92% |
| Greenway | 43% | 75% | 95% |
| Grey | 54% | 82% | 92% |
| Griffith | 37% | 69% | 93% |
| Groom | 35% | 65% | 91% |
| Hasluck | 54% | 79% | 94% |
| Herbert | 37% | 62% | 87% |
| Higgins | 38% | 72% | 93% |
| Hindmarsh | 45% | 72% | 92% |
| Hinkler | 28% | 68% | 92% |
| Holt | 37% | 66% | 88% |
| Hotham | 42% | 71% | 95% |
| Hughes | 46% | 78% | 92% |
| Hume | 48% | 76% | 91% |
| Hunter | 44% | 74% | 92% |
| Indi | 42% | 77% | 91% |
| Isaacs | 38% | 67% | 90% |
| Jagajaga | 39% | 68% | 95% |
| Kennedy | 39% | 76% | 90% |
| Kingsford Smith | 37% | 69% | 91% |
| Kingston | 46% | 76% | 94% |
| Kooyong | 41% | 71% | 92% |
| La Trobe | 38% | 68% | 93% |
| Lalor | 33% | 63% | 93% |
| Leichhardt | 37% | 62% | 86% |
| Lilley | 40% | 71% | 92% |
| Lindsay | 42% | 70% | 92% |
| Lingiari | 33% | 71% | 86% |
| Longman | 34% | 71% | 94% |
| Lyne | 43% | 71% | 89% |
| Lyons | 60% | 78% | 89% |
| Macarthur | 43% | 75% | 94% |
| Mackellar | 38% | 72% | 91% |
| Macnamara | 37% | 65% | 90% |
| Macquarie | 47% | 72% | 91% |
| Makin | 46% | 76% | 94% |
| Mallee | 44% | 76% | 91% |
| Maranoa | 43% | 85% | 95% |
| Maribyrnong | 38% | 69% | 92% |
| Mayo | 49% | 78% | 91% |
| McEwen | 38% | 70% | 87% |
| McMahon | 50% | 80% | 95% |
| McPherson | 31% | 68% | 94% |
| Melbourne | 39% | 71% | 94% |
| Menzies | 41% | 68% | 93% |
| Mitchell | 41% | 77% | 94% |
| Monash | 42% | 70% | 85% |
| Moncrieff | 33% | 66% | 92% |
| Moore | 57% | 82% | 94% |
| Moreton | 46% | 71% | 89% |
| New England | 37% | 72% | 91% |
| Newcastle | 45% | 69% | 90% |
| Nicholls | 41% | 75% | 89% |
| North Sydney | 44% | 76% | 94% |
| O'Connor | 46% | 77% | 93% |
| Oxley | 41% | 75% | 94% |
| Page | 38% | 71% | 89% |
| Parkes | 45% | 79% | 94% |
| Parramatta | 47% | 78% | 95% |
| Paterson | 40% | 71% | 90% |
| Pearce | 53% | 85% | 96% |
| Perth | 48% | 77% | 95% |
| Petrie | 36% | 66% | 92% |
| Rankin | 35% | 73% | 93% |
| Reid | 48% | 75% | 93% |
| Richmond | 32% | 65% | 87% |
| Riverina | 38% | 76% | 92% |
| Robertson | 35% | 66% | 91% |
| Ryan | 44% | 75% | 94% |
| Scullin | 35% | 65% | 89% |
| Shortland | 50% | 73% | 90% |
| Solomon | 33% | 63% | 85% |
| Spence | 48% | 75% | 92% |
| Stirling | 51% | 77% | 94% |
| Sturt | 47% | 77% | 95% |
| Swan | 46% | 78% | 94% |
| Sydney | 40% | 71% | 92% |
| Tangney | 56% | 80% | 95% |
| Wannon | 40% | 77% | 91% |
| Warringah | 35% | 70% | 92% |
| Watson | 45% | 78% | 96% |
| Wentworth | 33% | 68% | 91% |
| Werriwa | 44% | 72% | 92% |
| Whitlam | 41% | 70% | 92% |
| Wide Bay | 39% | 73% | 92% |
| Wills | 41% | 66% | 88% |
| Wright | 45% | 80% | 95% |