# QLD state predictor from Senate 4PP - how'd it do?
Date: 2018-01-09
Projections
Predictor
Analysis •
Any predictor is not much good unless it’s been tested.
There are two aspects to the predictor. The first is using federal
Senate data to estimate state Legislative Assembly voting patterns at
all. The second is applying changes (i.e. swings) from the 2016 Senate
context to the 2017 State context.
As such there are two phases to the analysis. First we’ll look at change
from 2016 to 2017. Then we’ll estimate the equivalent statewide 4PP that
we might’ve seen if Qld had an upper house, feed that through the
predictor, and look at the differences to reality.
Now, eleven districts had either an independent or a Katter candidate in
the top three, with three Katter wins and one independent. We’ll return
to Katter sporadically, but generally those districts are excluded from
analysis.
Using the ECQ’s published distribution of preferences, we can collate
4PPs for our selected parties in about half the seats. We can collate
3PPs in about two-thirds of seats (where the predicted and actual
top-three parties are the same) and where a 4PP isn’t available a 3PP
might be.
------------------------------------------------------------------------
## Comparison to 2016
In 2016, the following (normalised) 4PP results occurred:
- **Greens 11.08% **
- **Labor 31.86% **
- **Liberal National 41.40% **
- **One Nation 15.66% **
Putting those numbers through the predictor results in 36 Labor seats,
56 Liberal National and 1 One Nation.
### 4PP districts
We can perform a four-party-preferred comparison for 46 out of 93
districts. Many districts don’t have a ONP candidate and some of the
ones that do don’t have a 4PP (or rather, their 4CP doesn’t match the
four parties we’ve chosen for our 4PP). However, of the 4PPs which can
be evaluated:
| Greens |
- 0.62% |
± 0.74% |
| Labor |
+ 3.57% |
± 4.16% |
| Liberal National |
- 7.80% |
± 7.80% |
| One Nation |
+ 4.51% |
± 4.56% |
*Median difference is calculated as the median of the 2017 results minus
the 2016 results. Median error is calculated as the median of the
absolute differences between 2016 and 2017.*
The following graphs plot the 4PP results in seats where they were
available. Points above the dotted line represent seats in which the
party’s 2017 result outperformed its 2016 result.
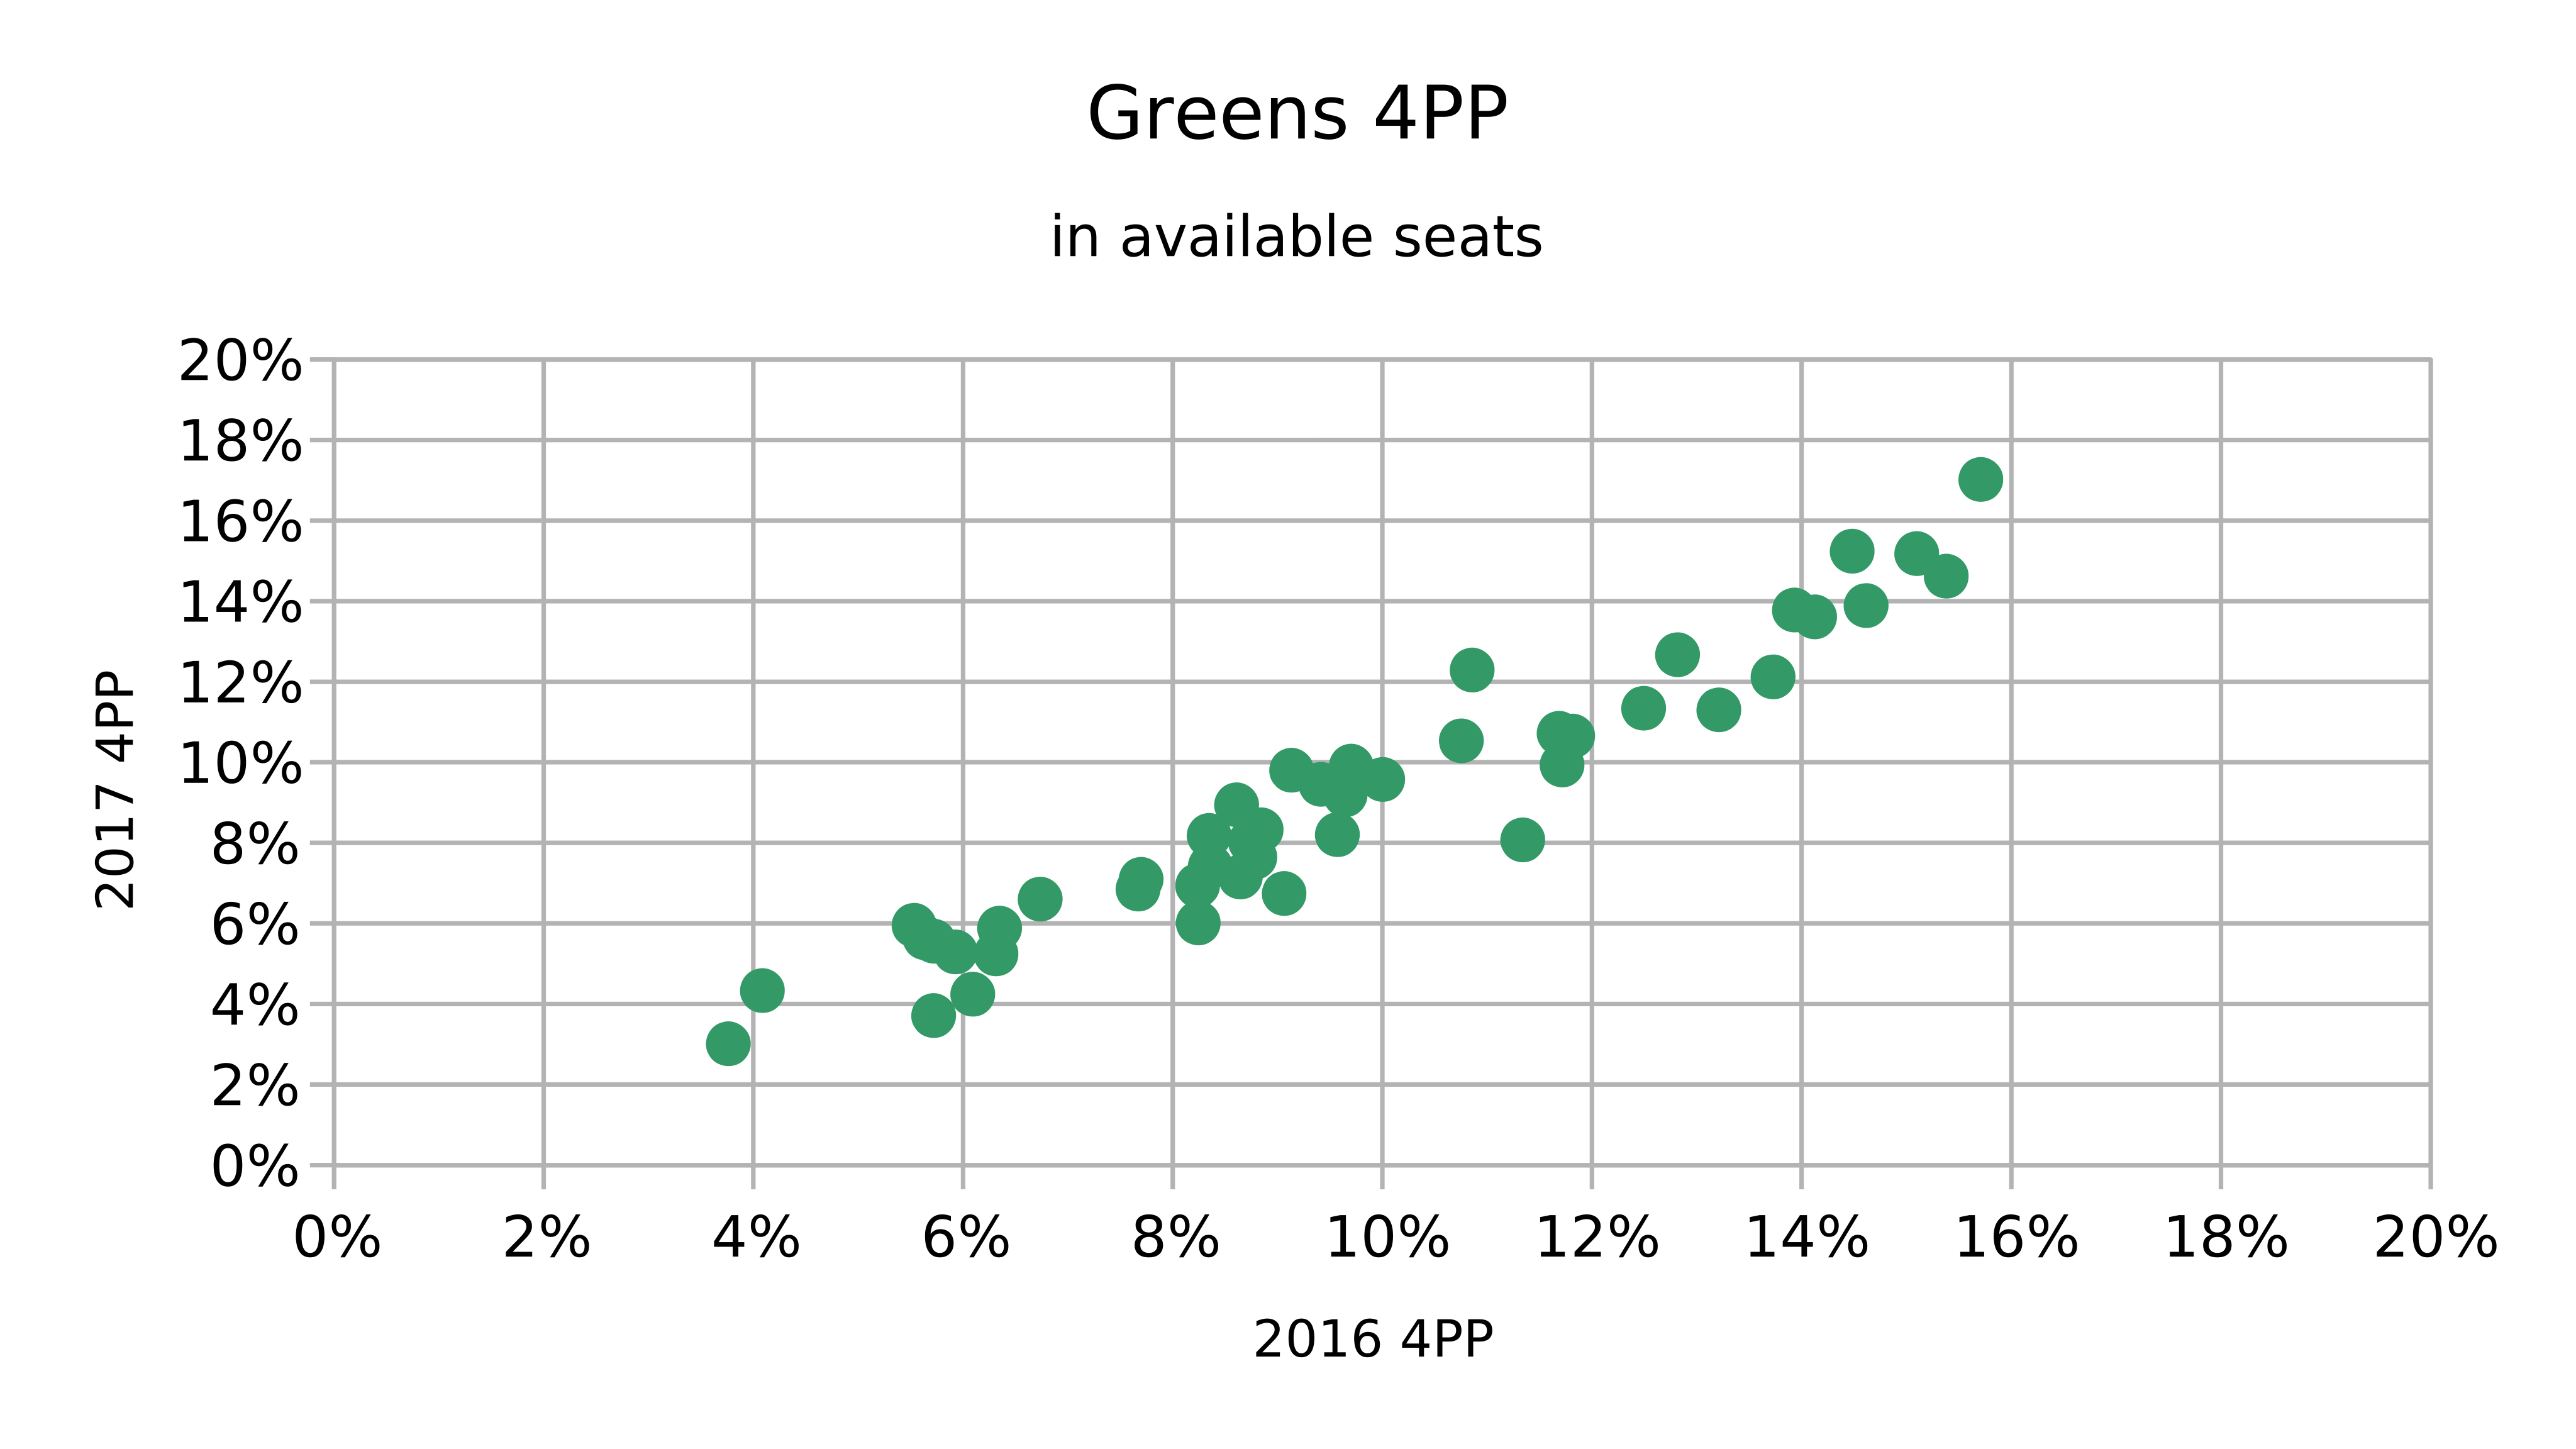
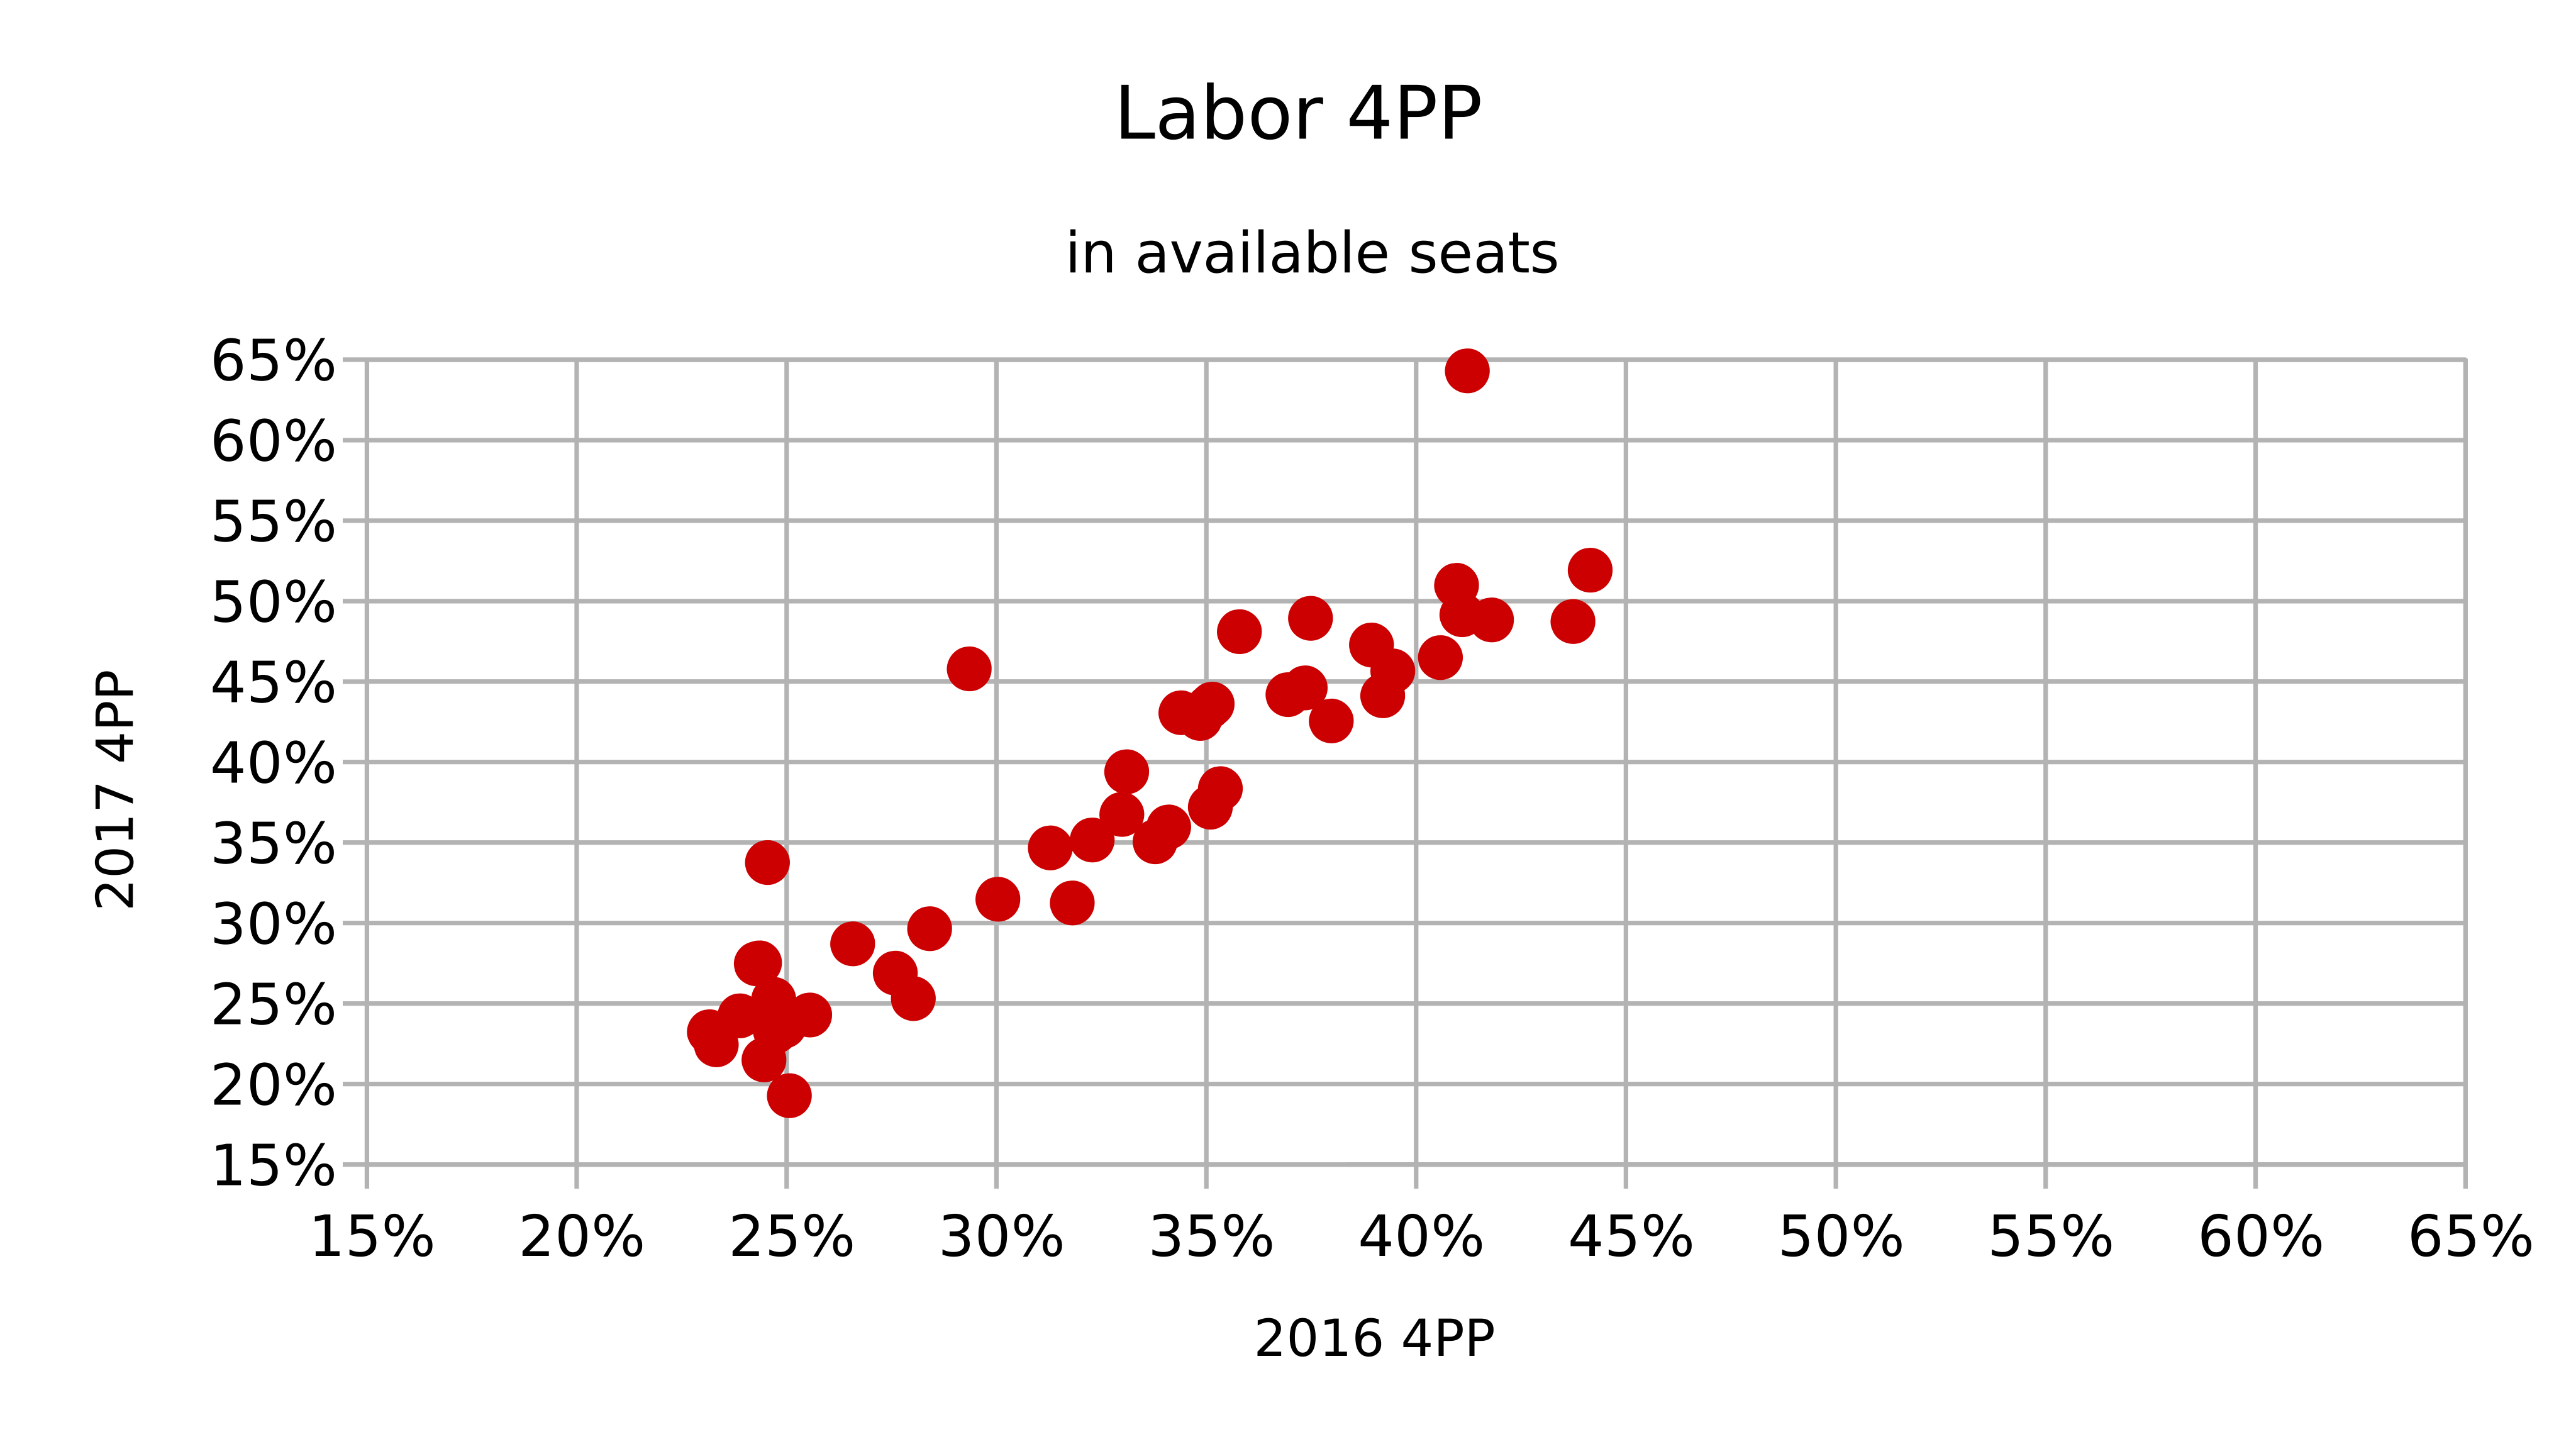
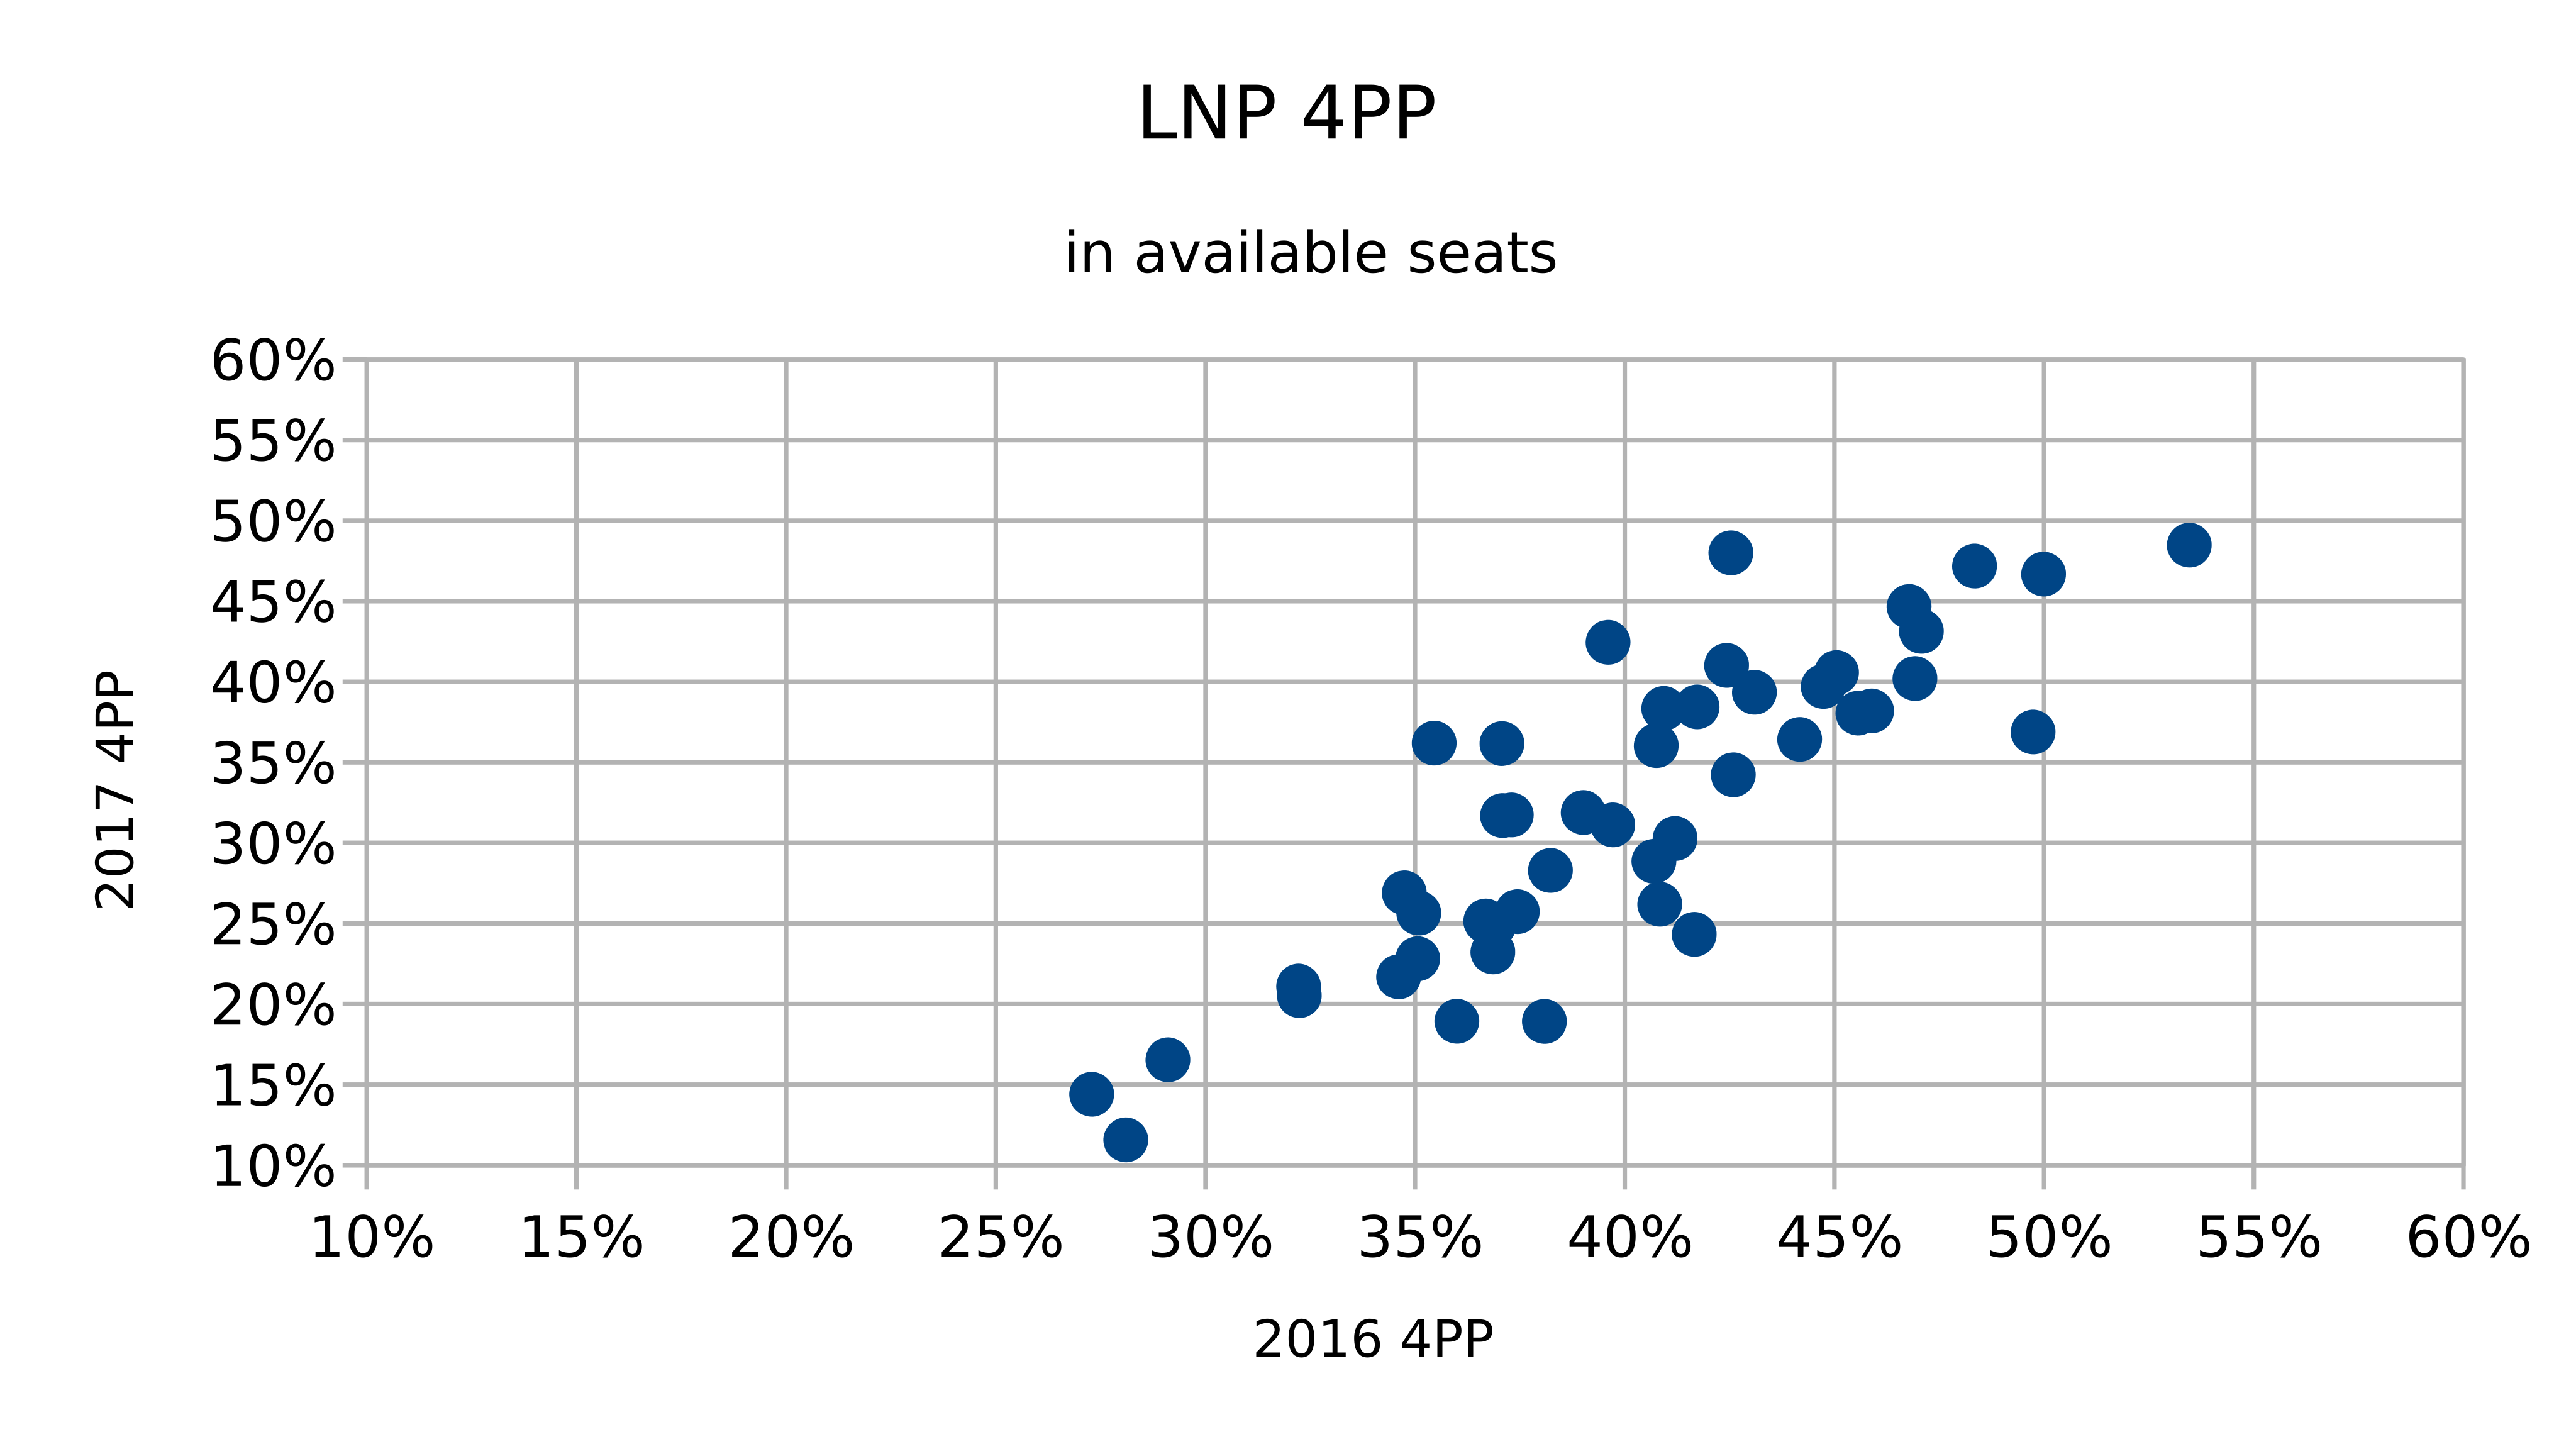 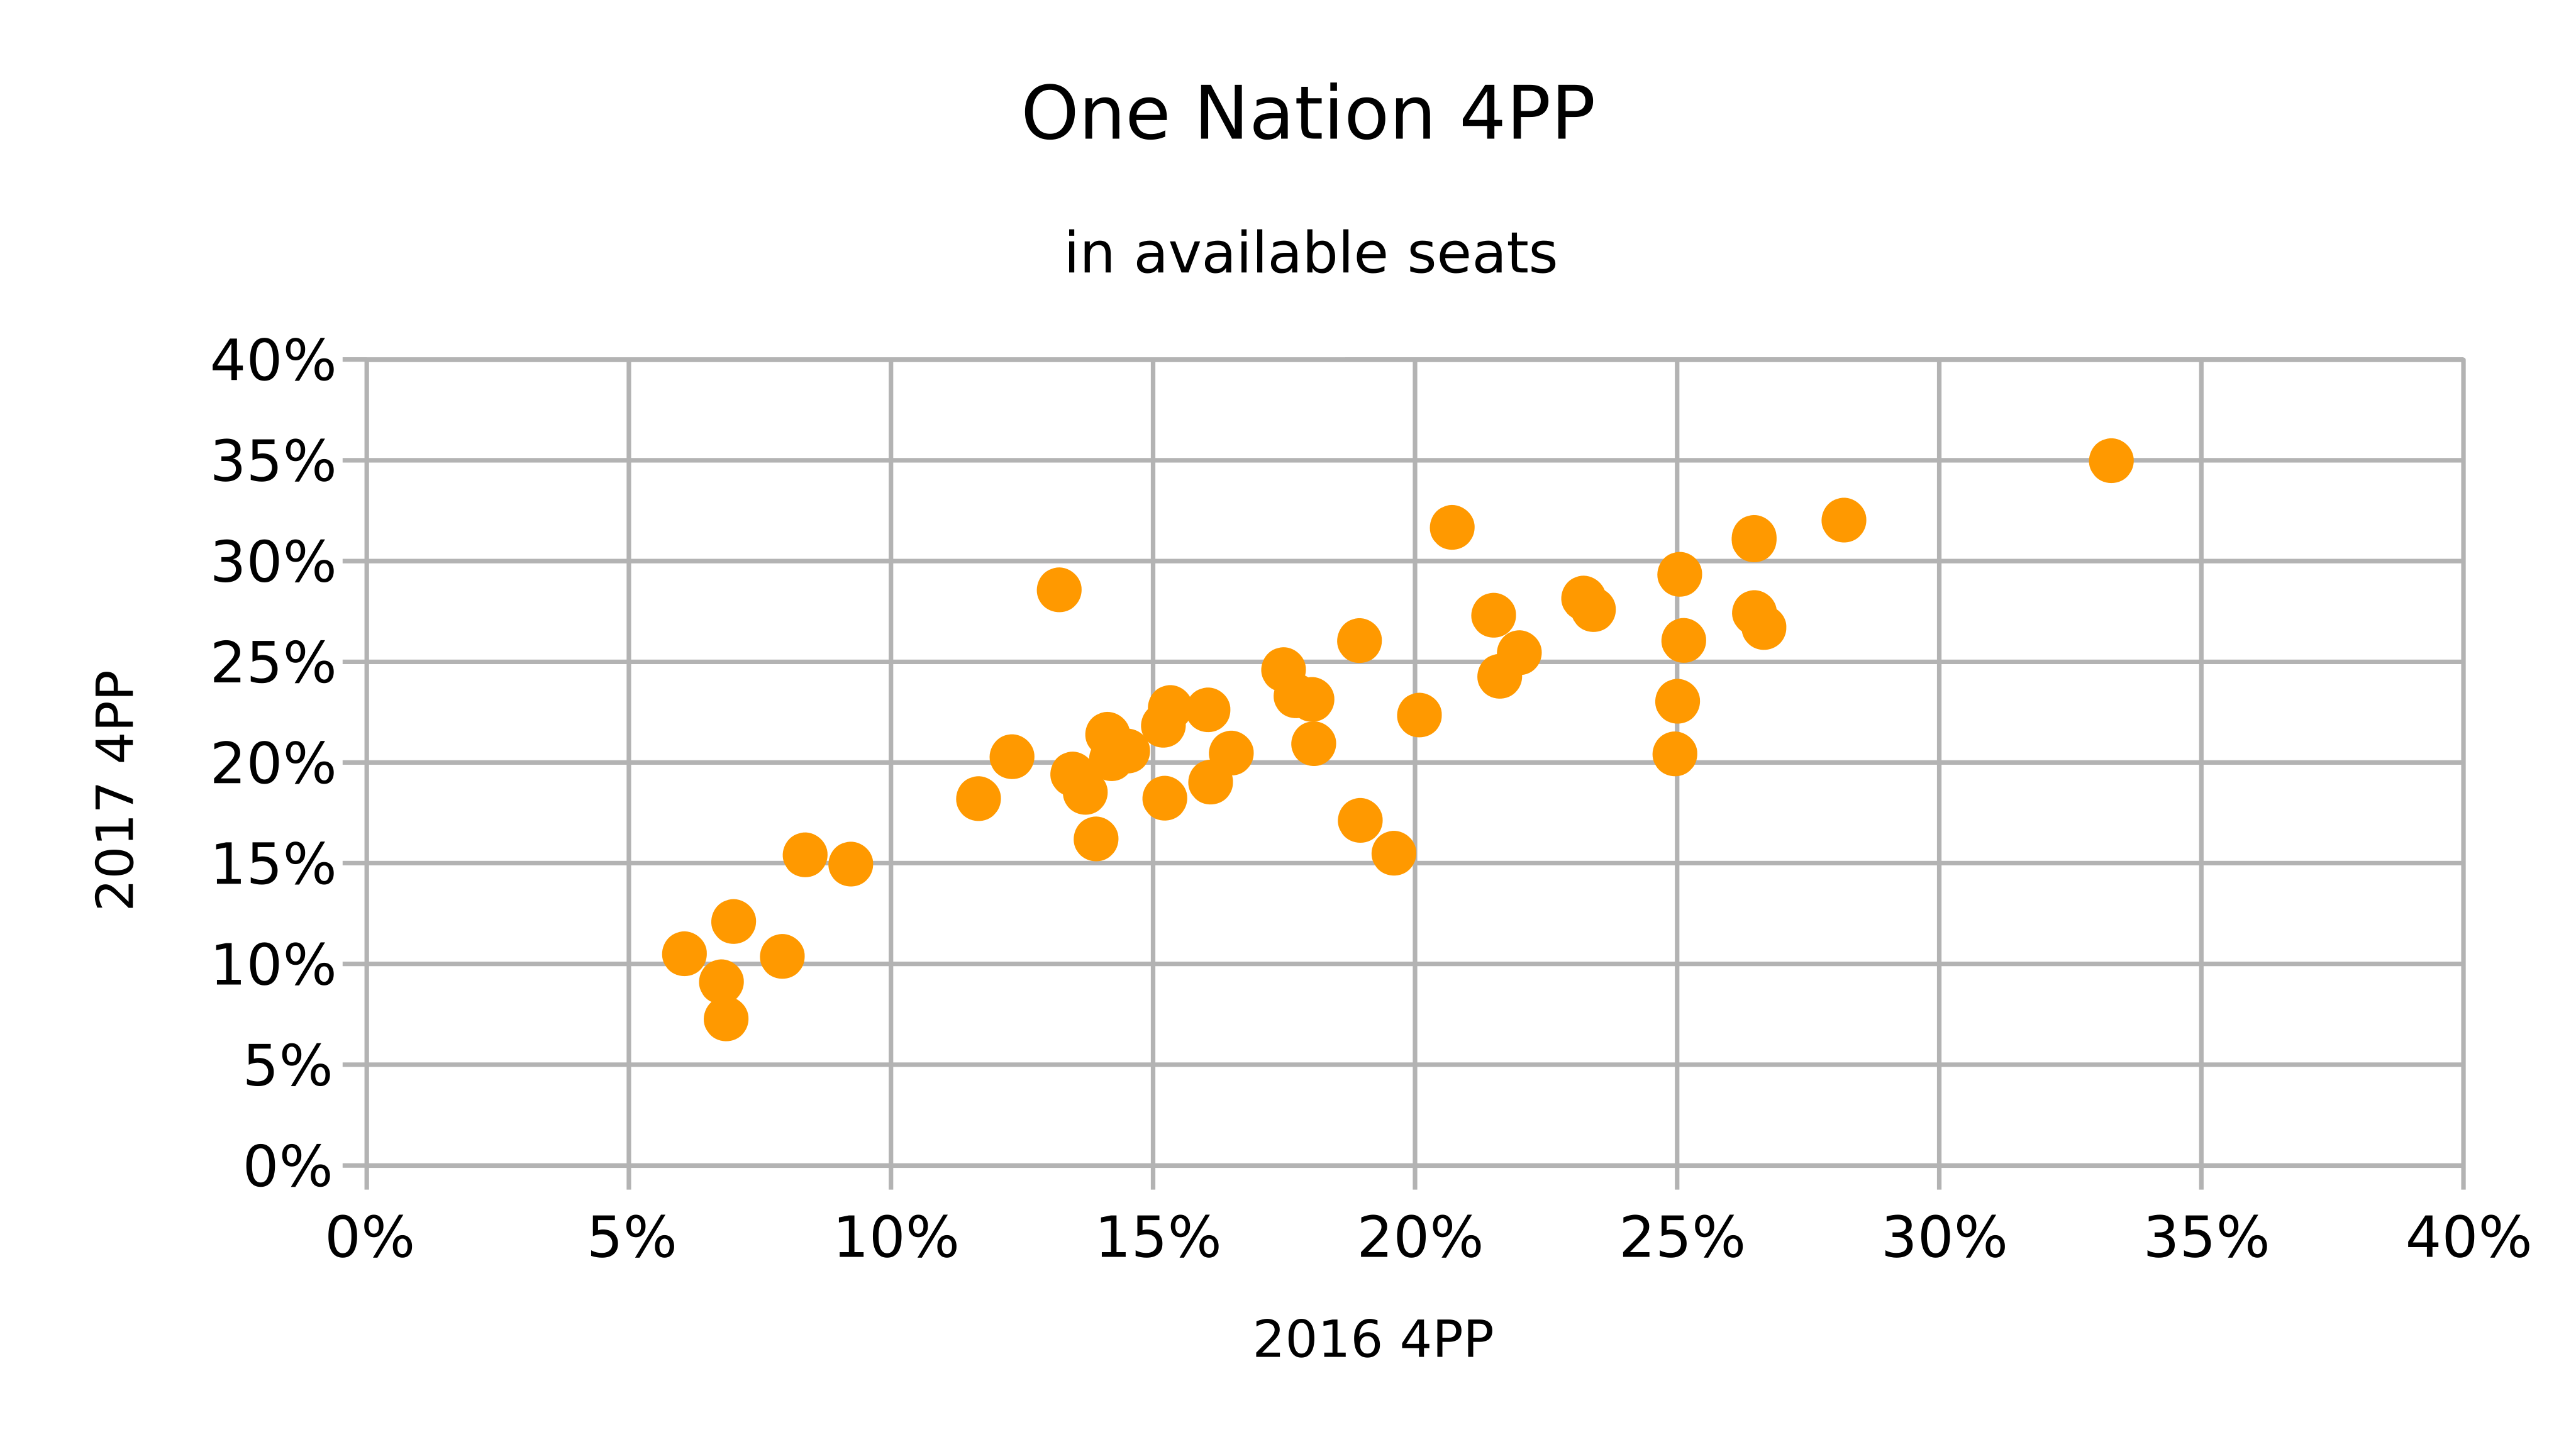
There’s some interesting behaviour in these graphs: Labor tended to
outperform their 2016 result in their stronger seats. Conversely the
Coalition tended to underperform in their weaker seats. One Nation
mostly outperformed and if anywhere their strongest outperformances were
in their middle seats. Greens underperformed slightly across the board.
### 3PP districts
69 districts had the same set of candidates come top-three as would’ve
according to the 2016 4PP. Of the 24 that didn’t:
- one district (Noosa) had an independent victory;
- one district (Warrego) had KAP come second (vs LNP);
- three districts (Hill, Hinchinbrook, Traeger) had KAP victories (Hill
& Hinchinbrook vs LNP, Traeger vs ALP);
- one district (Pine Rivers) had the Greens come third in 2016, but
exclude outside the top four in 2017 with One Nation coming third;
- six districts (Bonney, Gaven, Kawana, Oodgeroo, Redcliffe, Springwood)
had One Nation come third in 2016 but either finished outside the top
four or didn’t stand a candidate in 2017, which resulted in the Greens
coming third;
- six districts (Buderim, Lytton, Maroochydore, Ninderry, Sandgate,
Stretton) had the Greens coming third in 2016, but pushed down to
fourth by One Nation in 2017;
- six districts (Bundamba, Cairns, Macalister, Rockhampton, Southern
Downs, Woodridge) had an independent finish in third (behind the
majors).
So in 2016: 32 GRN + majors, 61 ONP + majors. In 2017, 30 GRN + majors,
52 ONP + majors, 11 other.
In 29 districts it was possible to calculate a 3PP but not a 4PP. Of
those districts:
| Greens |
- 0.01% |
± 1.92% |
| Labor |
+ 4.06% |
± 4.22% |
| Liberal National |
- 7.83% |
± 7.83% |
| One Nation |
+ 6.39% |
± 6.39% |
*Median difference is calculated as the median of the 2017 results minus
the 2016 results. Median error is calculated as the median of the
absolute differences between 2016 and 2017.*
The following graphs plot the 3PP results in seats for which the 4PP
wasn’t calculable. Points above the dotted line represent seats in which
the party’s 2017 result outperformed its 2016 result.
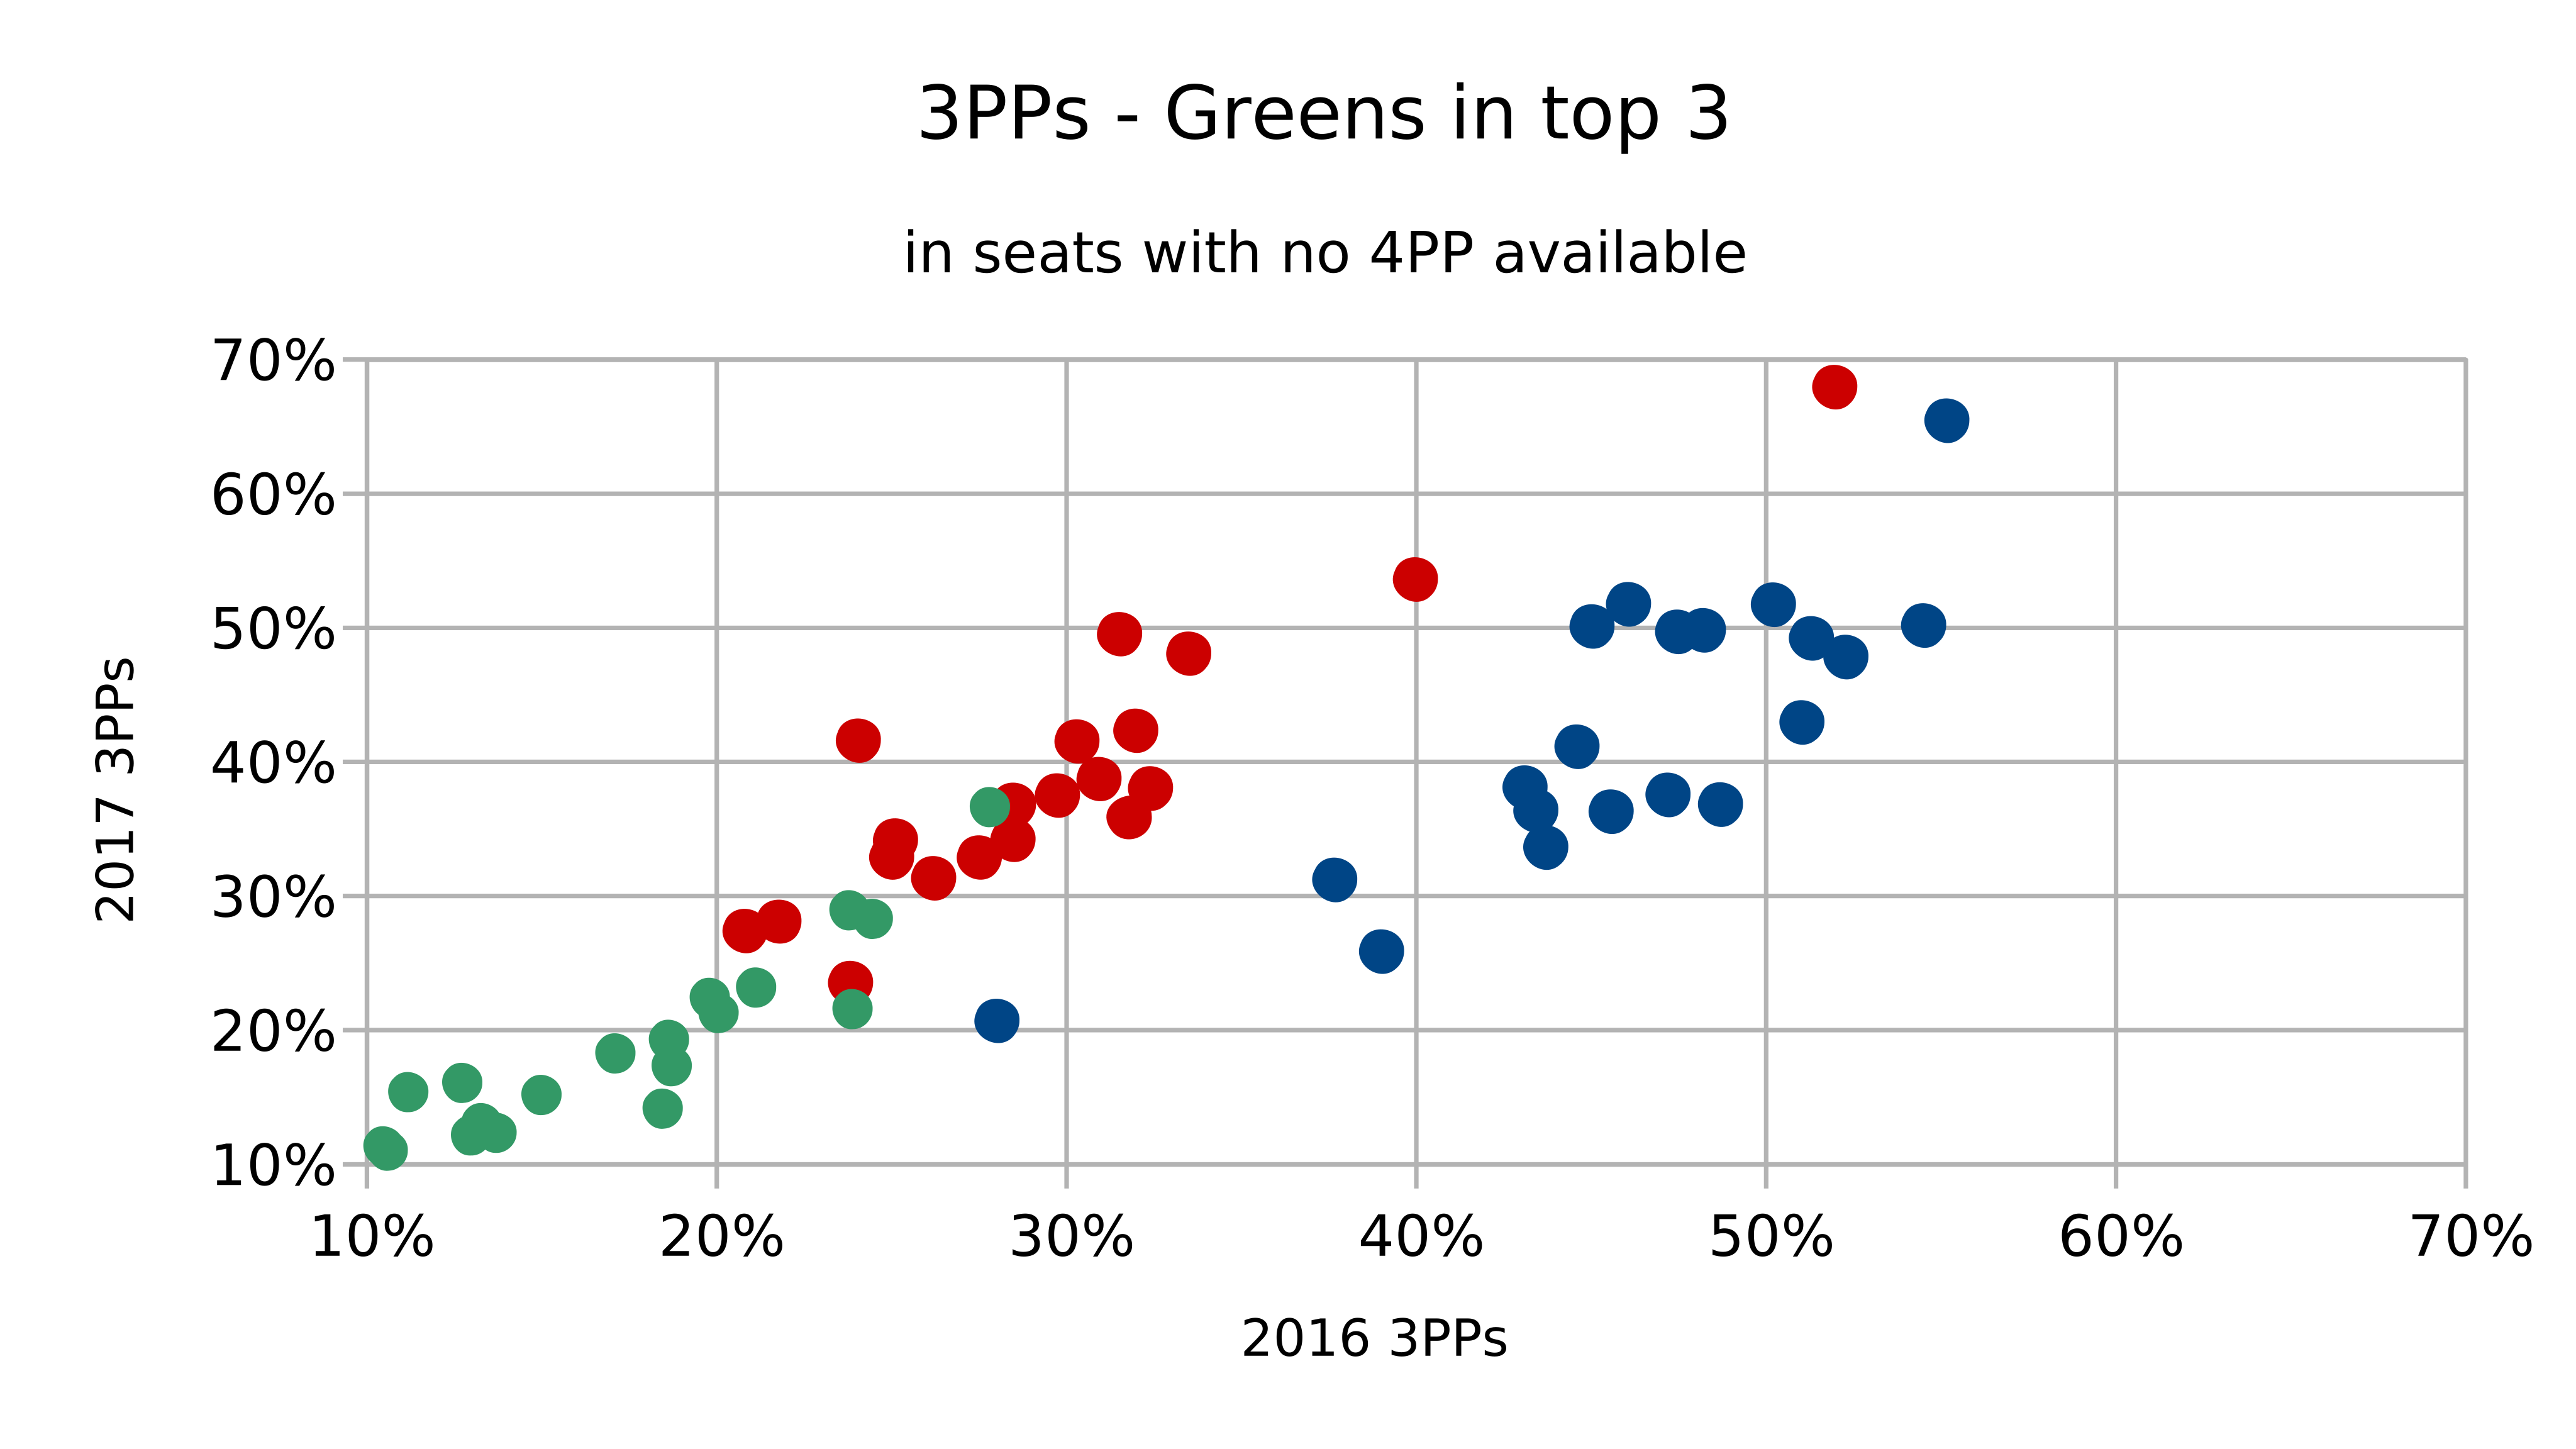 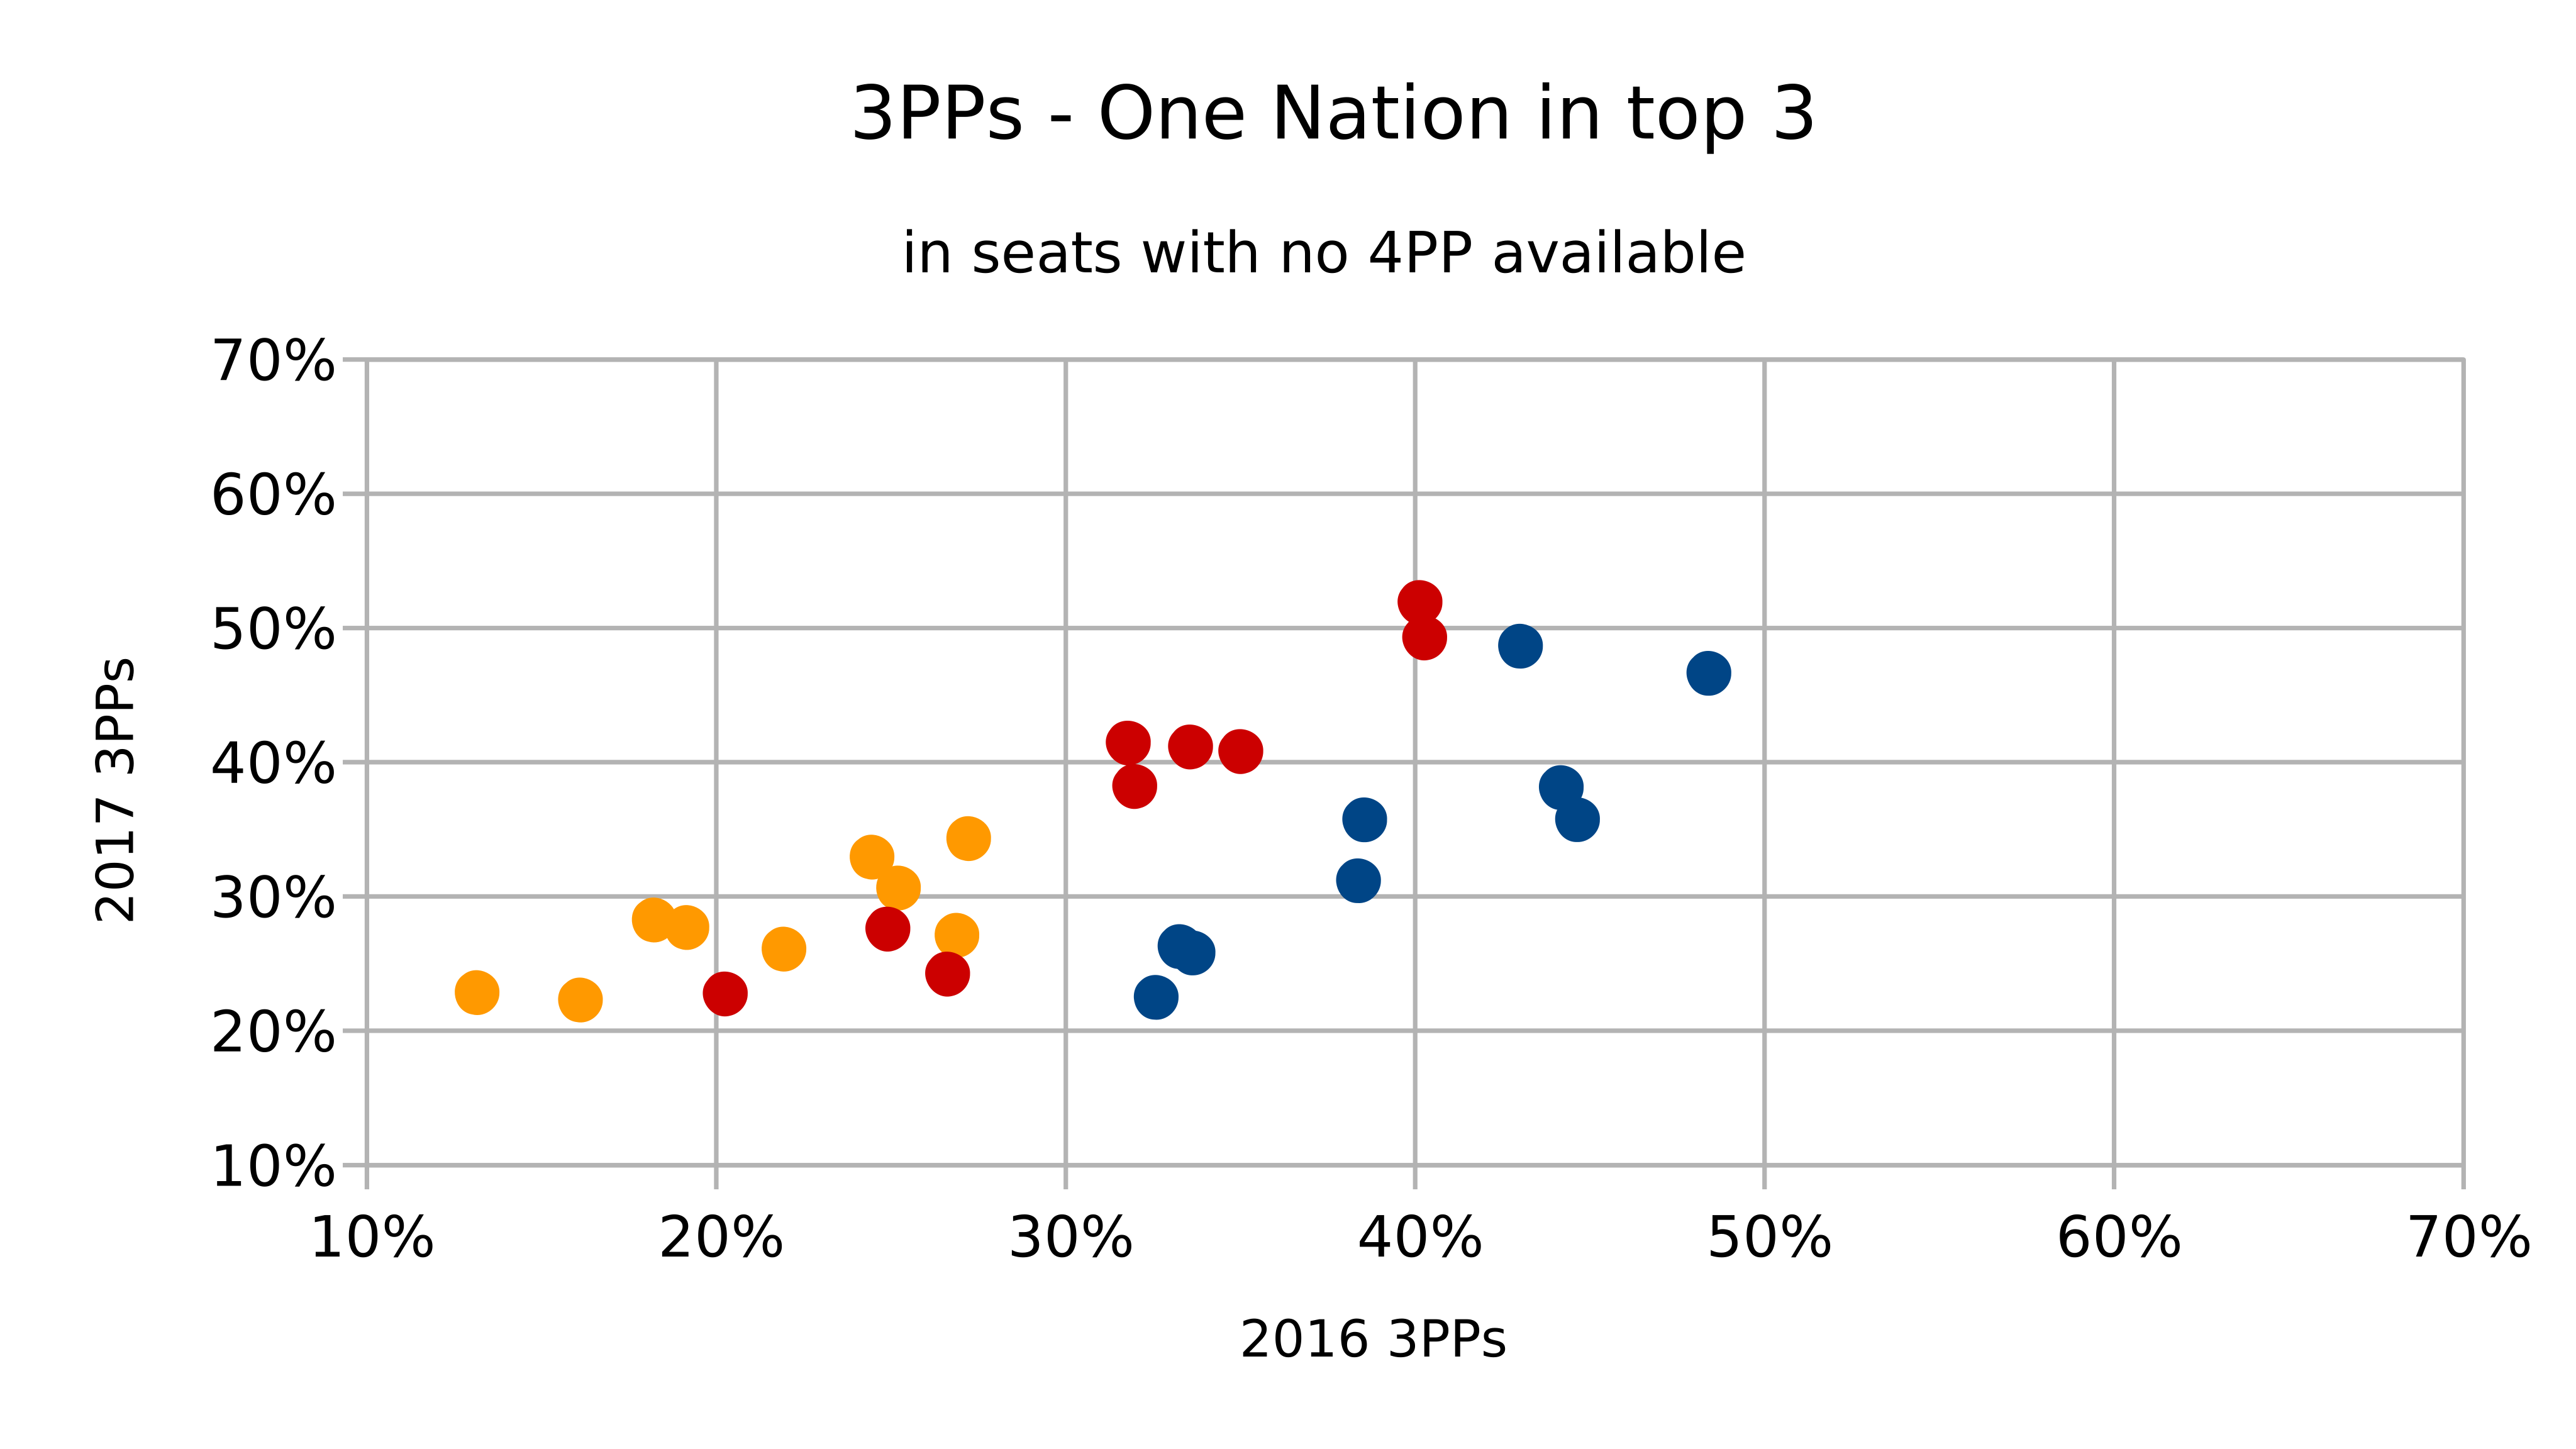
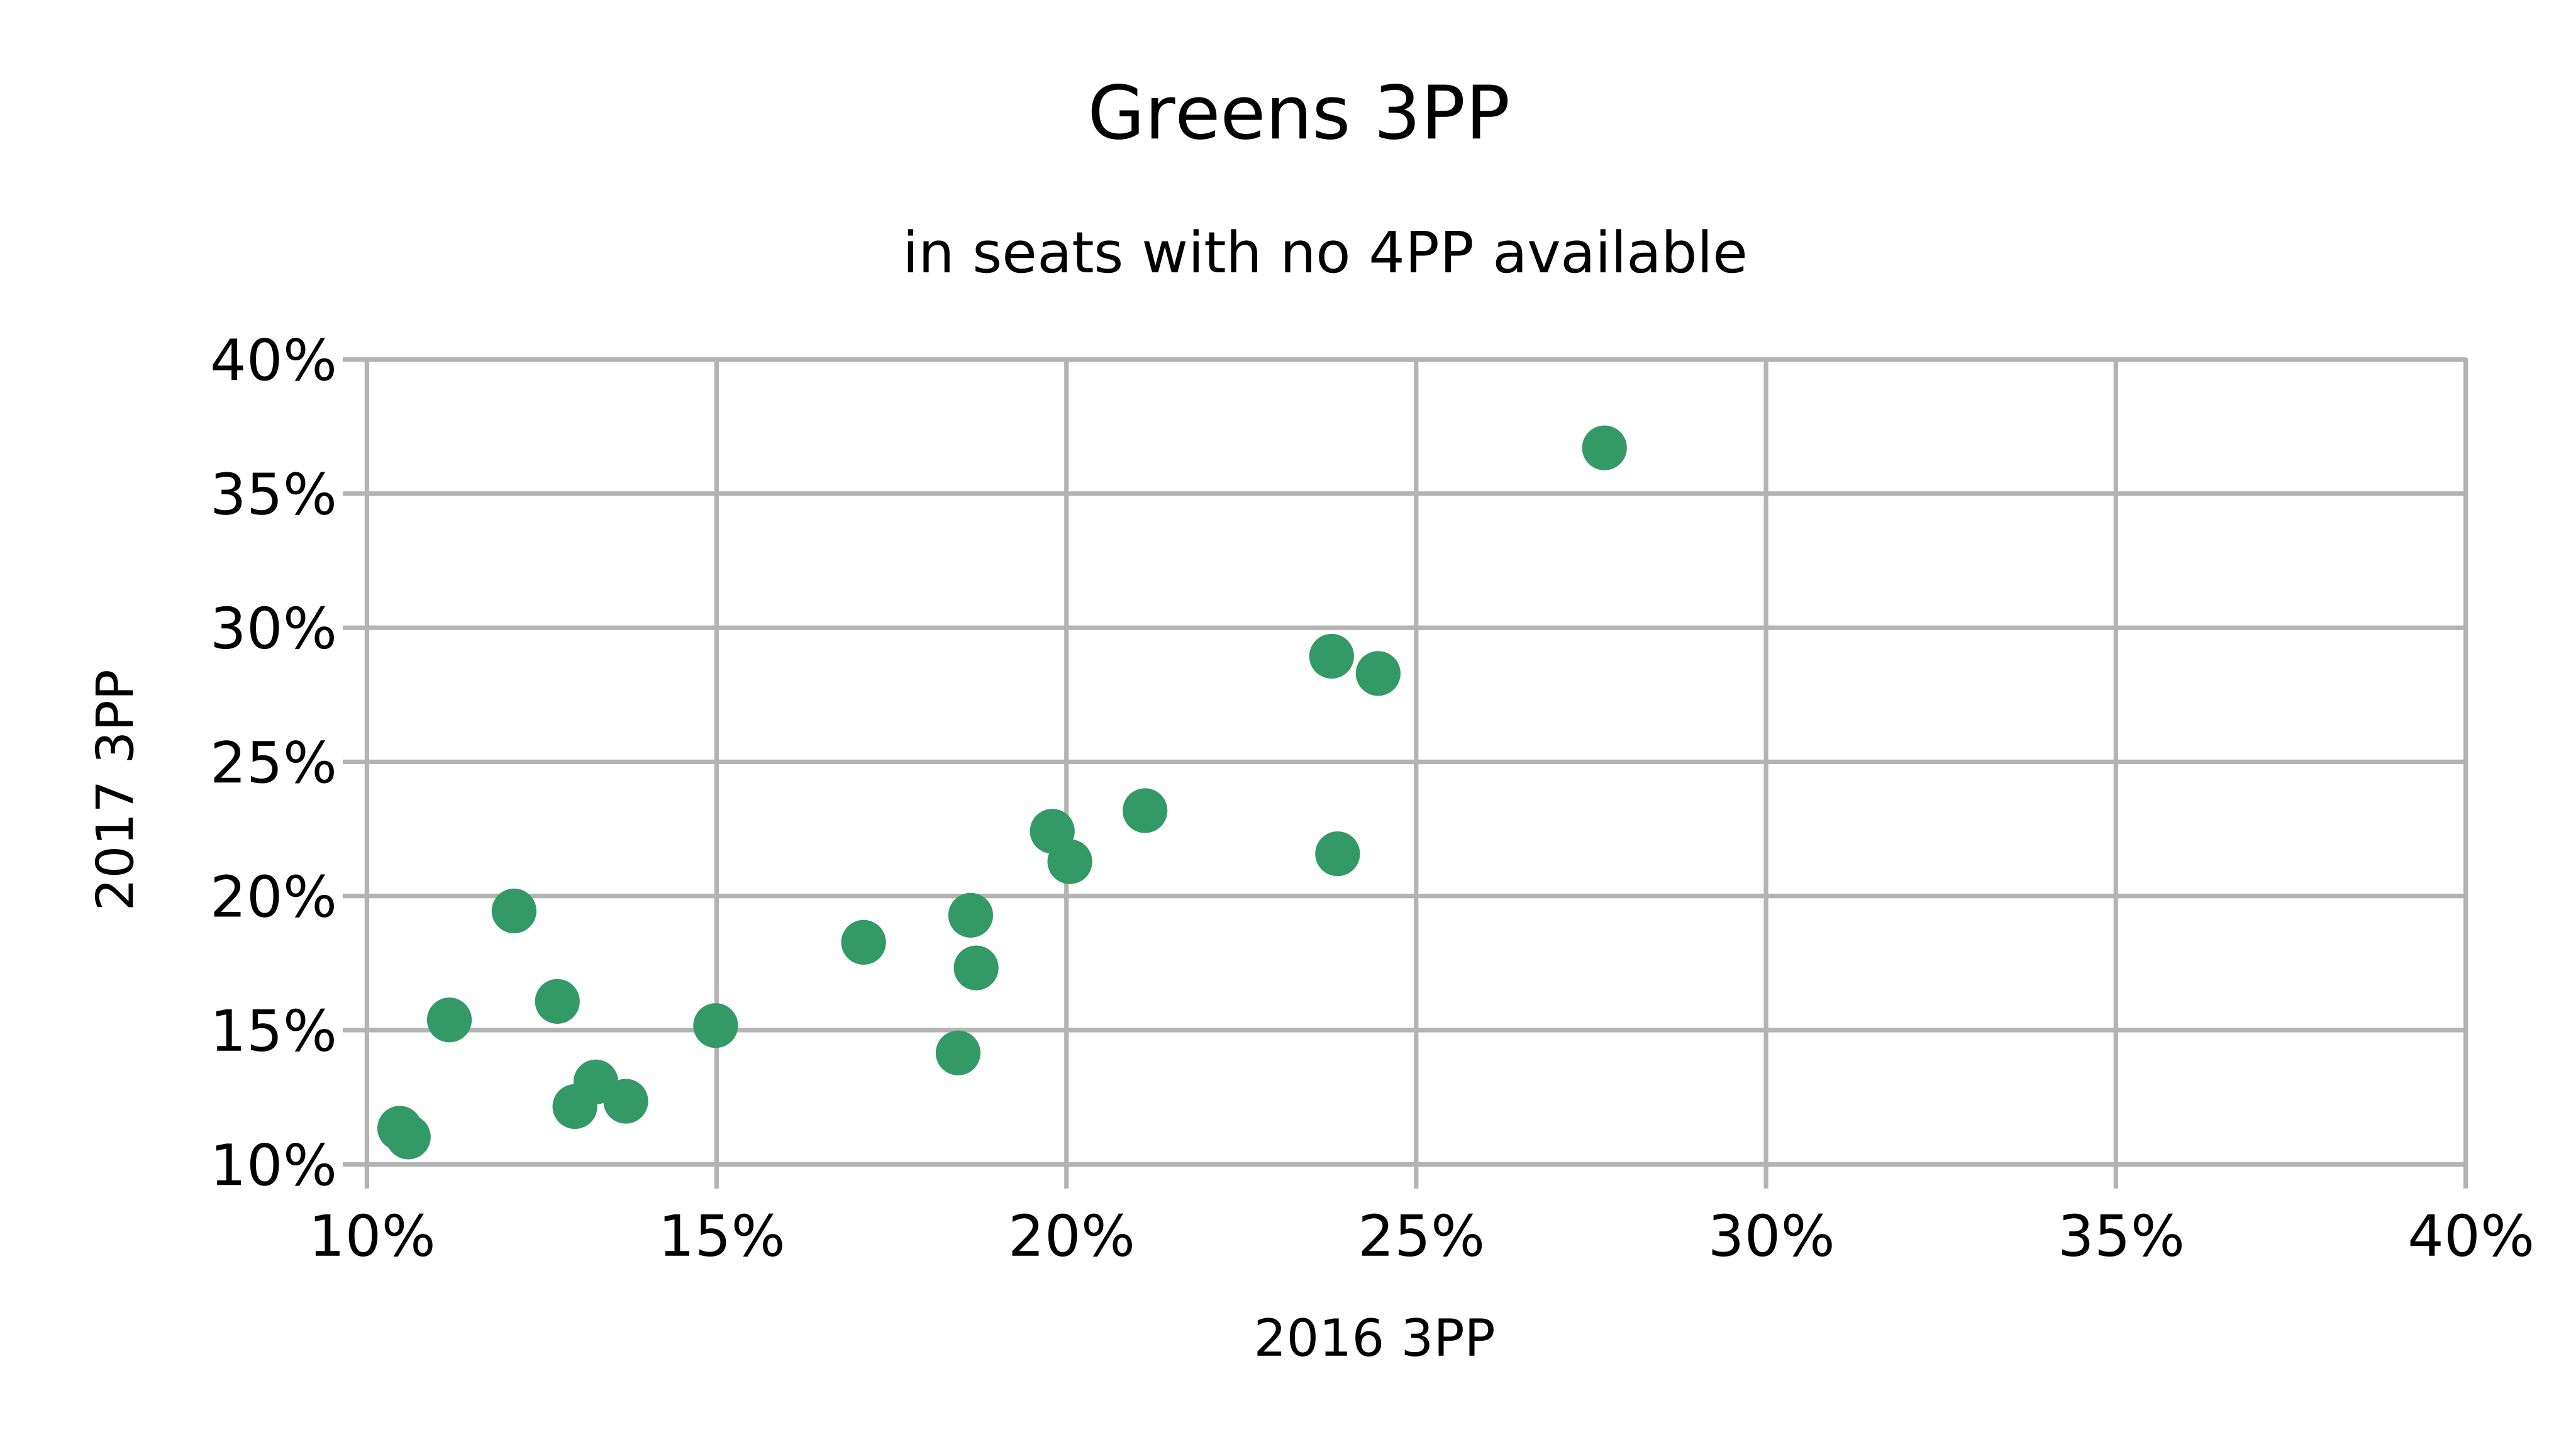
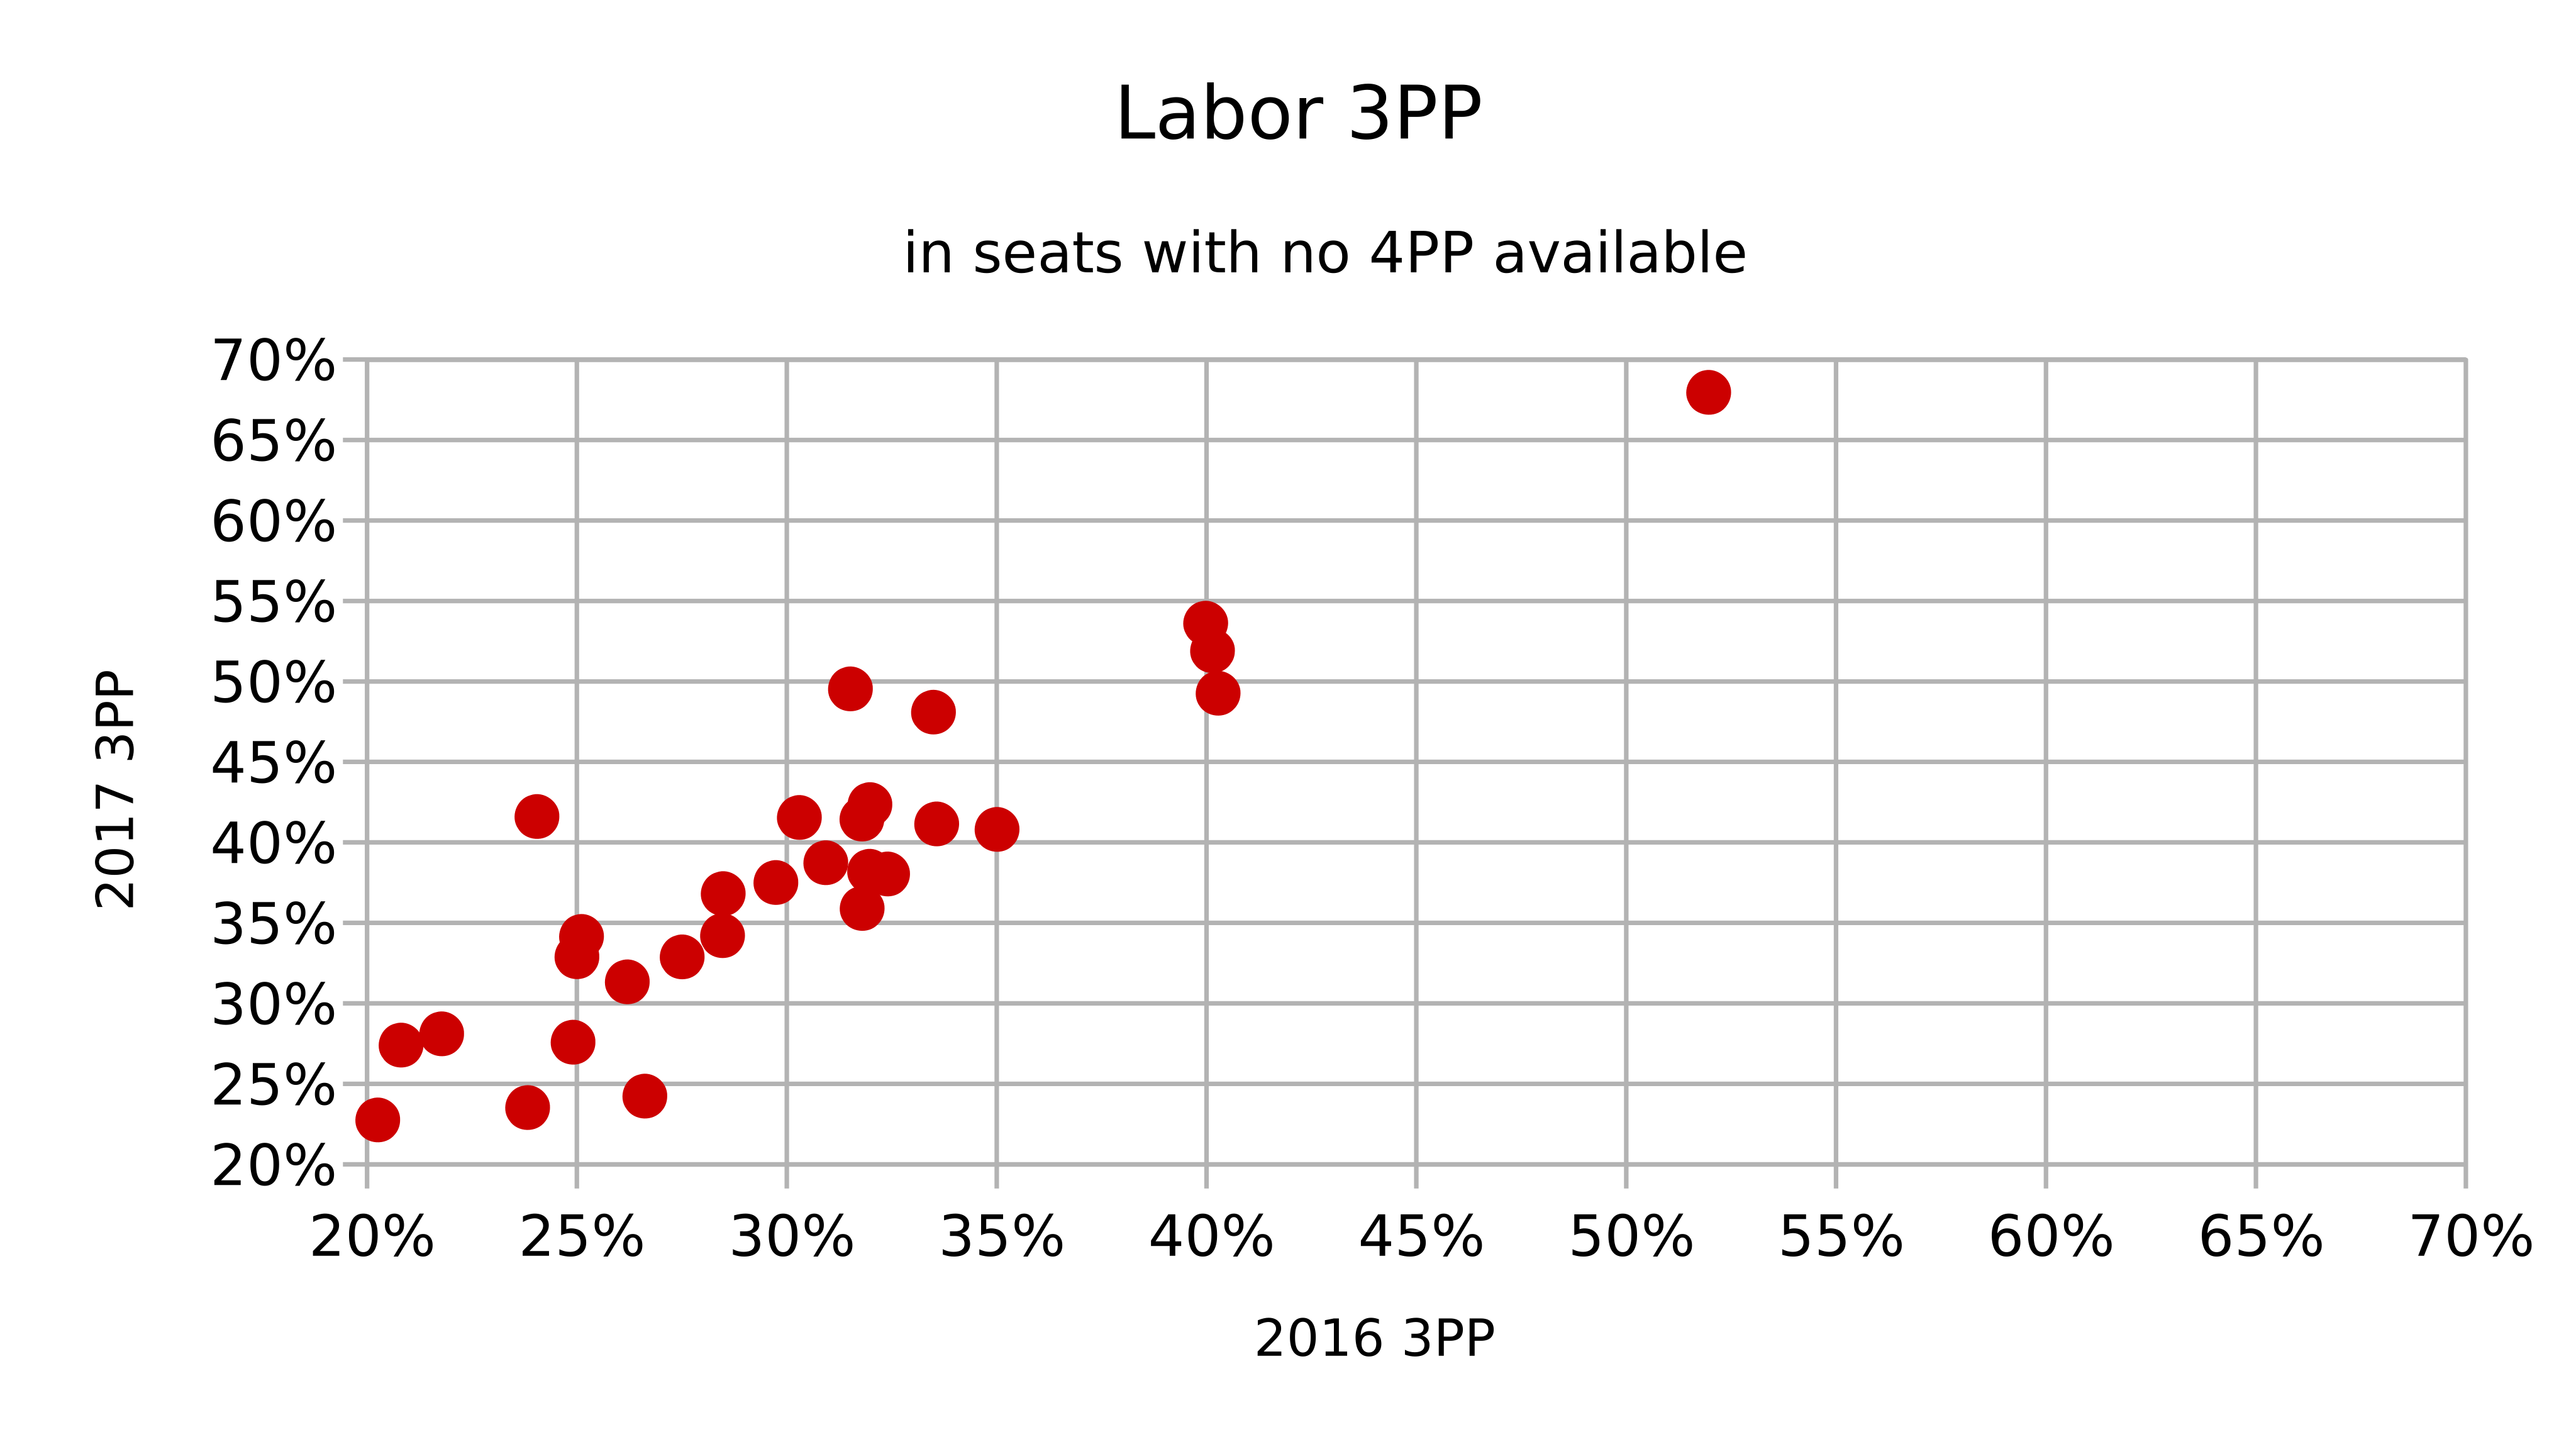
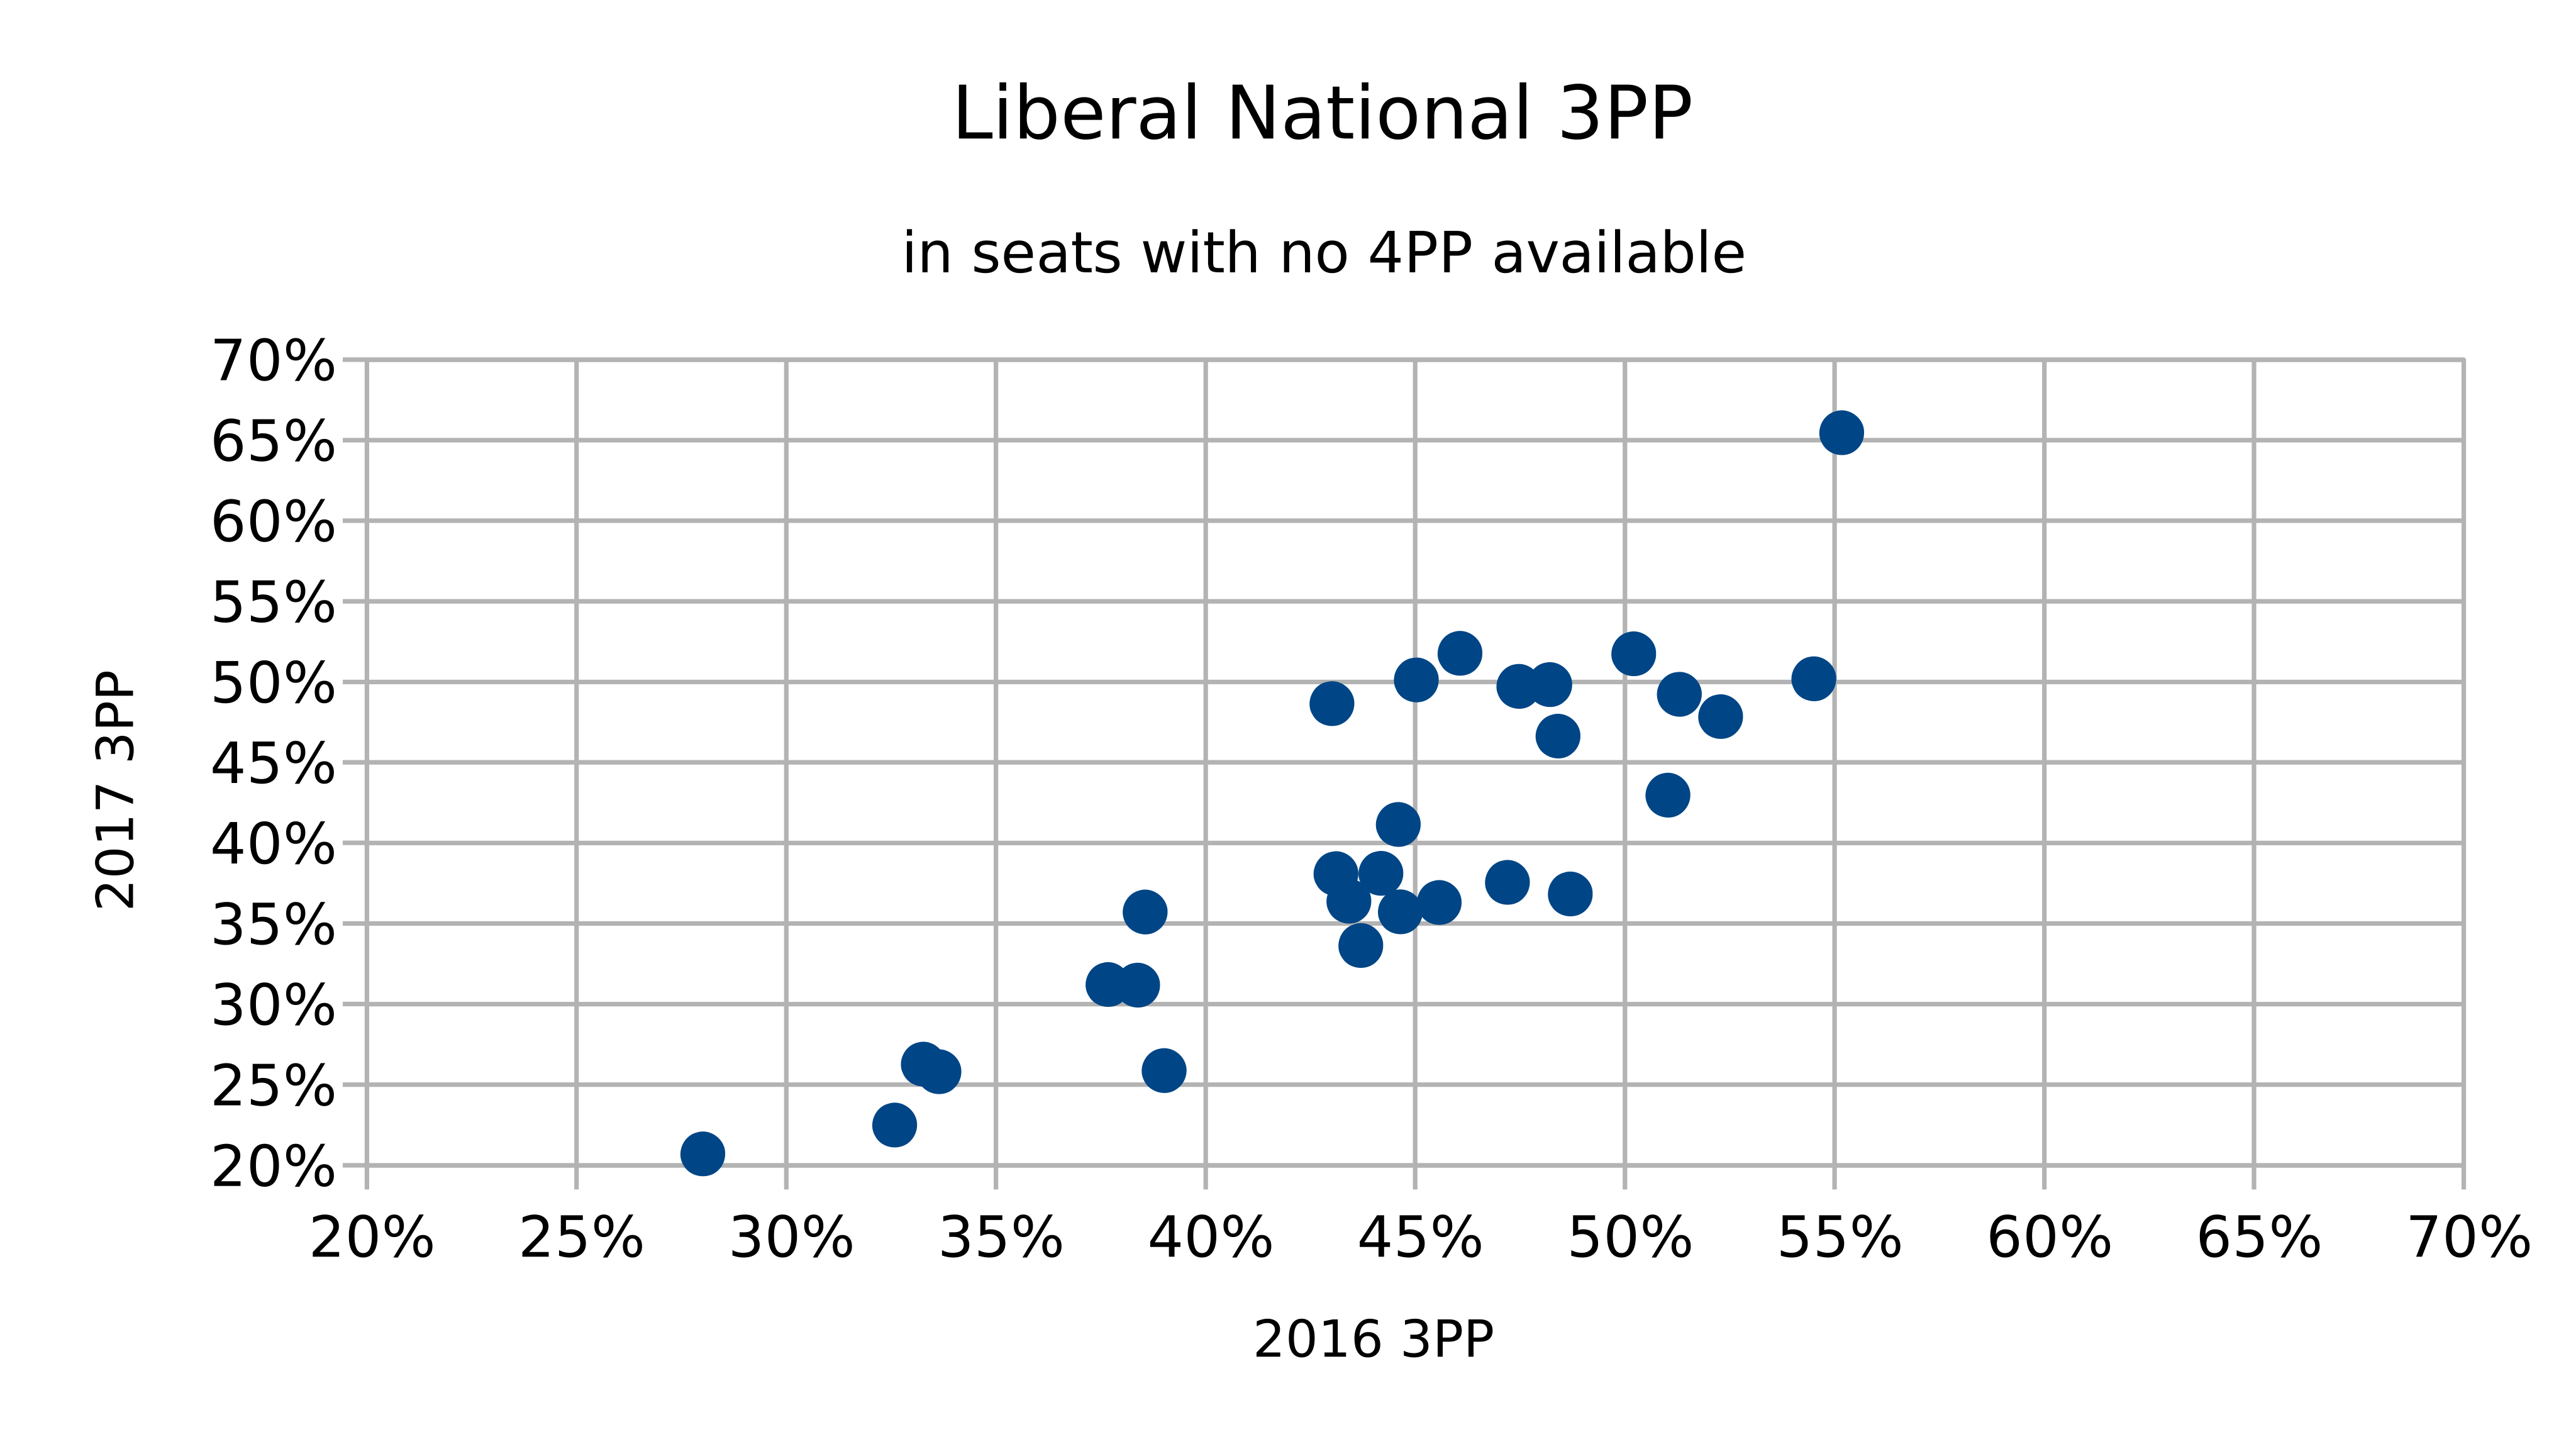 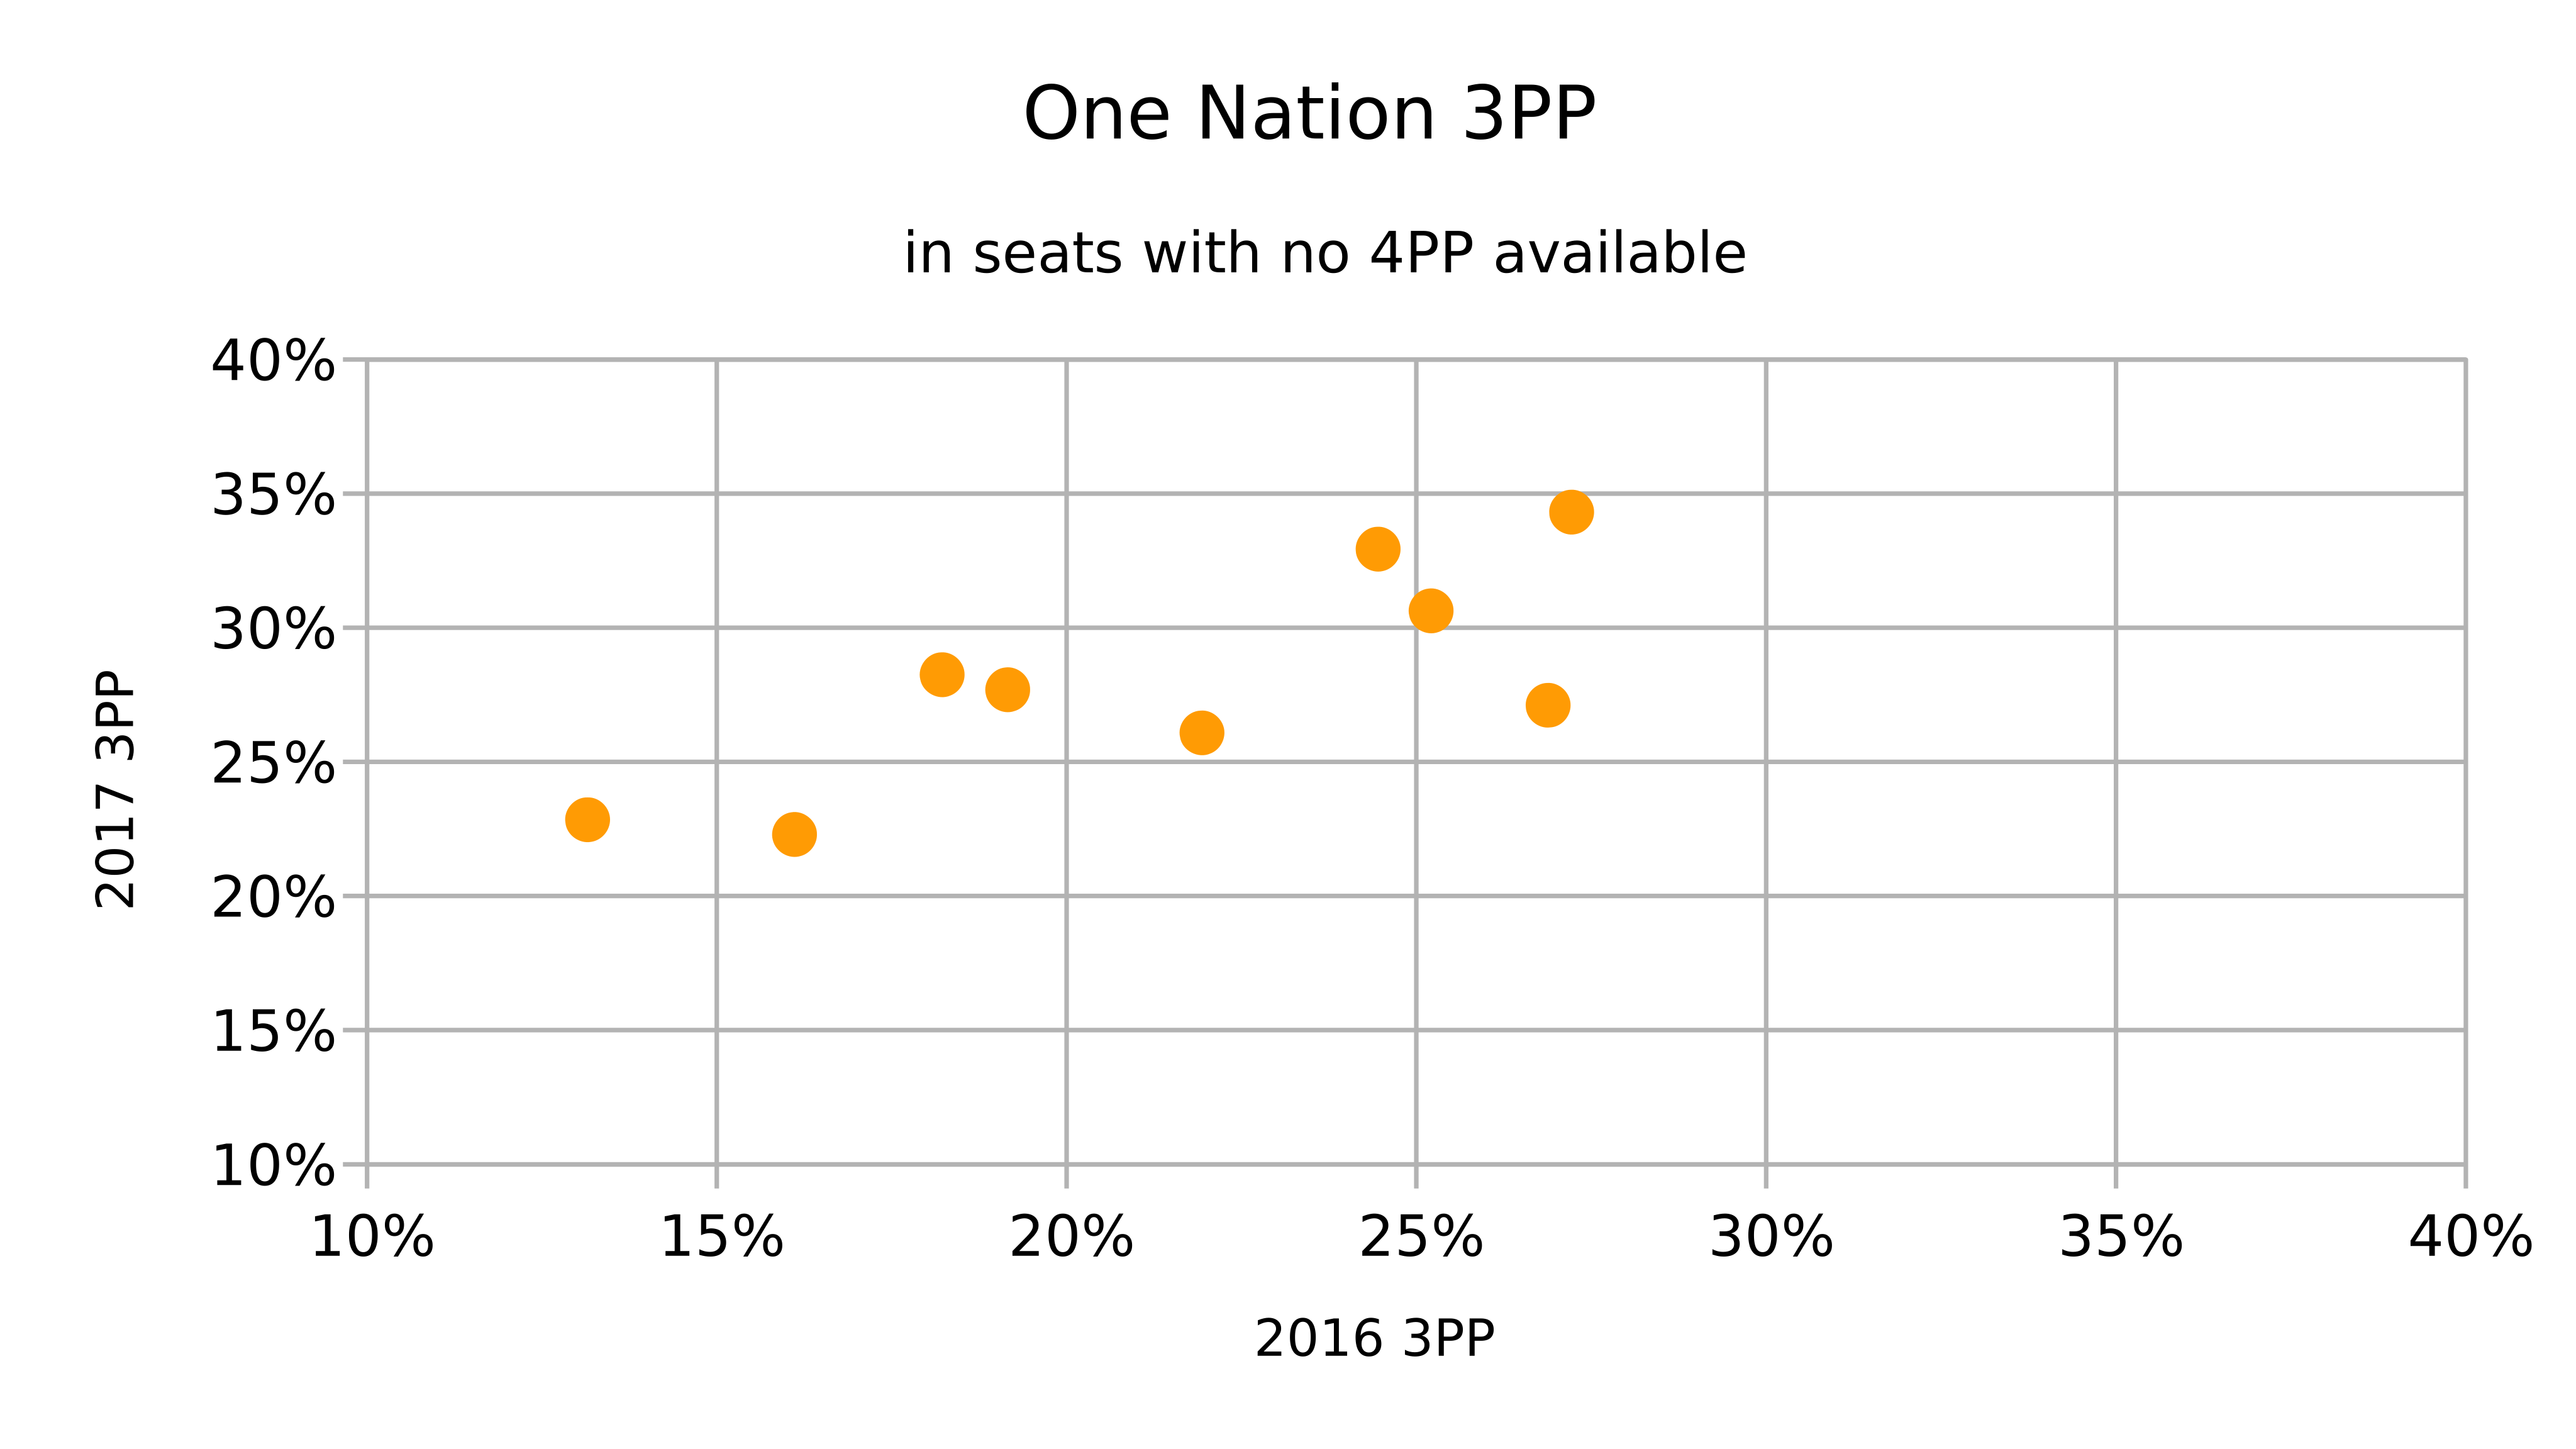
In general everyone except One Nation here seems to have outperformed at
their high end (or conversely underperformed at their low end).
------------------------------------------------------------------------
## The Predicted model
### Determining nominal 4PPs
The first order of business when evaluating the predictor is to
determine what inputs it should be given. This is particularly
problematic in that the predictor operates on a four-party-preferred
basis and assumes that every party will be running in every seat.
Since not every party ran in every seat, this changes statewide
vote-shares. As an example, One Nation only ran in about 2/3 of seats.
Had they ran in the remaining seats and gotten their 2016 4PP result in
them, their statewide 4PP would be about 18.5%.
Opinion polling isn’t much help either, because once nominations are
closed, the pollsters can account for candidates not running too.
I’ve attempted to synthesise a statewide 4PP by:
- calculating the average (mean) swing for each party in the 46 4PP
seats
- applying that swing (linearly rather than with cubic splines, purely
for convenience) to the 2016 result in the 47 non-4PP seats
- taking the average (mean) result for each party.
Having done that the values add up to 104%, so normalising that down
results in:
| Greens |
10.51% |
- 0.57% |
| Labor |
36.50% |
+ 4.94% |
| Liberal National |
33.68% |
- 7.72% |
| One Nation |
19.41% |
+ 3.75% |
Plugging those values into the predictor gives us 58 Labor seats, 28
Liberal National and 7 One Nation, with a 2PP of 53.99% to Labor
(actual: 51.2%).
The Greens didn’t even make the top 2 in any predicted seats.
For context, One Nation’s predicted seat count rises **dramatically**
once their 4PP gets to 21%.
In the interests of epistemic rigour, I should note that I didn’t
pre-commit to any method of synthesising a 4PP. Indeed in the lead up to
the election I merely estimated them by taking the primaries, allocating
the KAP votes as half to One Nation and half to the LNP and then
normalising out the ‘others’.
Again, 46 seats will be comparable on a 4PP basis, and this time around
24 seats will be comparable on a 3PP basis.
One last issue - the predicted district 4PPs don’t appear to be
normalised, although no total is off by more than 3%. That’s a bit of a
bug!
### Labor “predicted seats”
58 seats were predicted for Labor, and in reality they won 46 of those.
The remaining 12 all went to the Liberal Nationals (Bonney, Bundaberg,
Burdekin, Burnett, Chatsworth, Coomera, Currumbin, Everton, Glass House,
Pumicestone, Theodore and Whitsunday). In all 12 seats, Labor were the
runners-up.
Now, the predicted overall 2PP was 2.79 points more favourable to Labor
than in reality. Subtracting that 2.79% would make nine of those twelve
seats nominally LNP. Further, most of them had LNP incumbents anyway.
The seats gotten wrong on higher-than-the-2PP-error predicted margins
are:
- Burdekin (LNP incumbent)
- Pumicestone (ex-Labor incumbent via a scandal and a late
disendorsement, and the redistribution had nominally flipped the seat
to the LNP already)
- Whitsunday (LNP incumbent)
In all three of those seats the LNP did better than predicted on both
4PP and then One Nation preferences.
Meanwhile, there was also variance in the runner-up results in seats
that were correctly predicted as Labor wins:
- in six seats (Cook , Jordan, Keppel, Logan, Morayfield, Waterford) the
runner-up was One Nation rather than the LNP,
- in two seats (Woodridge and Bundamba) the LNP rather than One Nation
(who didn’t stand candidates),
- in one seat (South Brisbane) Green rather than the LNP.
### Liberal National “predicted seats”
28 seats were predicted for the Liberal Nationals, and in reality they
won 25 of those. The remaining three went to Labor (Gaven), the Greens
(Maiwar) and the independent (Noosa), and in all three seats the LNP
were the runners-up.
Gaven in reality was extremely close on 2PP. Maiwar was a Greens target
seat and greatly outperformed its prediction. Noosa was an independent —
completely outside the model.
Meanwhile, there was also variance in the runner-up results in seats
that were correctly predicted as Liberal National wins:
- in four seats (Gregory, Gympie, Nanango, Scenic Rim) the runner-up was
One Nation instead of Labor,
- in one seat (Warrego) Katter instead of One Nation.
- Maiwar and Noosa were predicted as LNP vs ALP.
### One Nation “predicted seats”
Seven seats were predicted for One Nation, and in reality they won one
of those. Three of the remaining six went to Katter (Hill, Hinchinbrook
and Traeger), two went to the Liberal Nationals (Callide and Lockyer)
and one went to Labor (Maryborough).
In Callide, Lockyer and Maryborough, One Nation were the runners-up.
Callide’s predicted 3PP figures were within 2%. There was a KAP
candidate here, but he came 4th and so we still have a 3PP. As expected,
Labor came third. However, the model had Labor preferences heavily
favouring One Nation, when in fact the opposite occurred, leaving
Callide in LNP hands.
Maryborough is a very interesting comparison. The model had One Nation
*just barely* edging out the LNP on 4PP and then going on to win. In
reality, the One Nation 4PP was essentially bang on. The Greens were a
bit weaker. But Labor did a whopping 12% better, and the LNP about 11.5%
worse. As a result, even though they split at almost 80% to One Nation,
LNP preferences weren’t enough and Labor retained the seat.
Lockyer was a particular upset to the model, although the end result
isn’t too surprising — it is usually a safe LNP seat. The model had One
Nation pushing the LNP into third and then beating Labor easily on LNP
preferences. Instead, the LNP vote held up, Labor came third by daylight
and their preferences put the LNP over the line — much like in 2015.
This suggests that the One Nation vote in Lockyer has found its
effective ceiling.
All three Katter seats were similarly modelled as One Nation beating
Labor, with the Liberals coming third. In Hill and Traeger, One Nation
declined to run candidates against the incumbent Katter MPs and
preferences barely mattered. In Hinchinbrook, Labor’s primary was only
two-thirds its predicted 4PP; the Katter candidate beat out Labor and
collected their preferences then did the same to One Nation to defeat
the LNP.
And then there’s Mirani, after all this analytical effort the sole One
Nation victory. The predicted 4PPs were all within a percent and so were
the 3PPs.
### 4PP comparisons
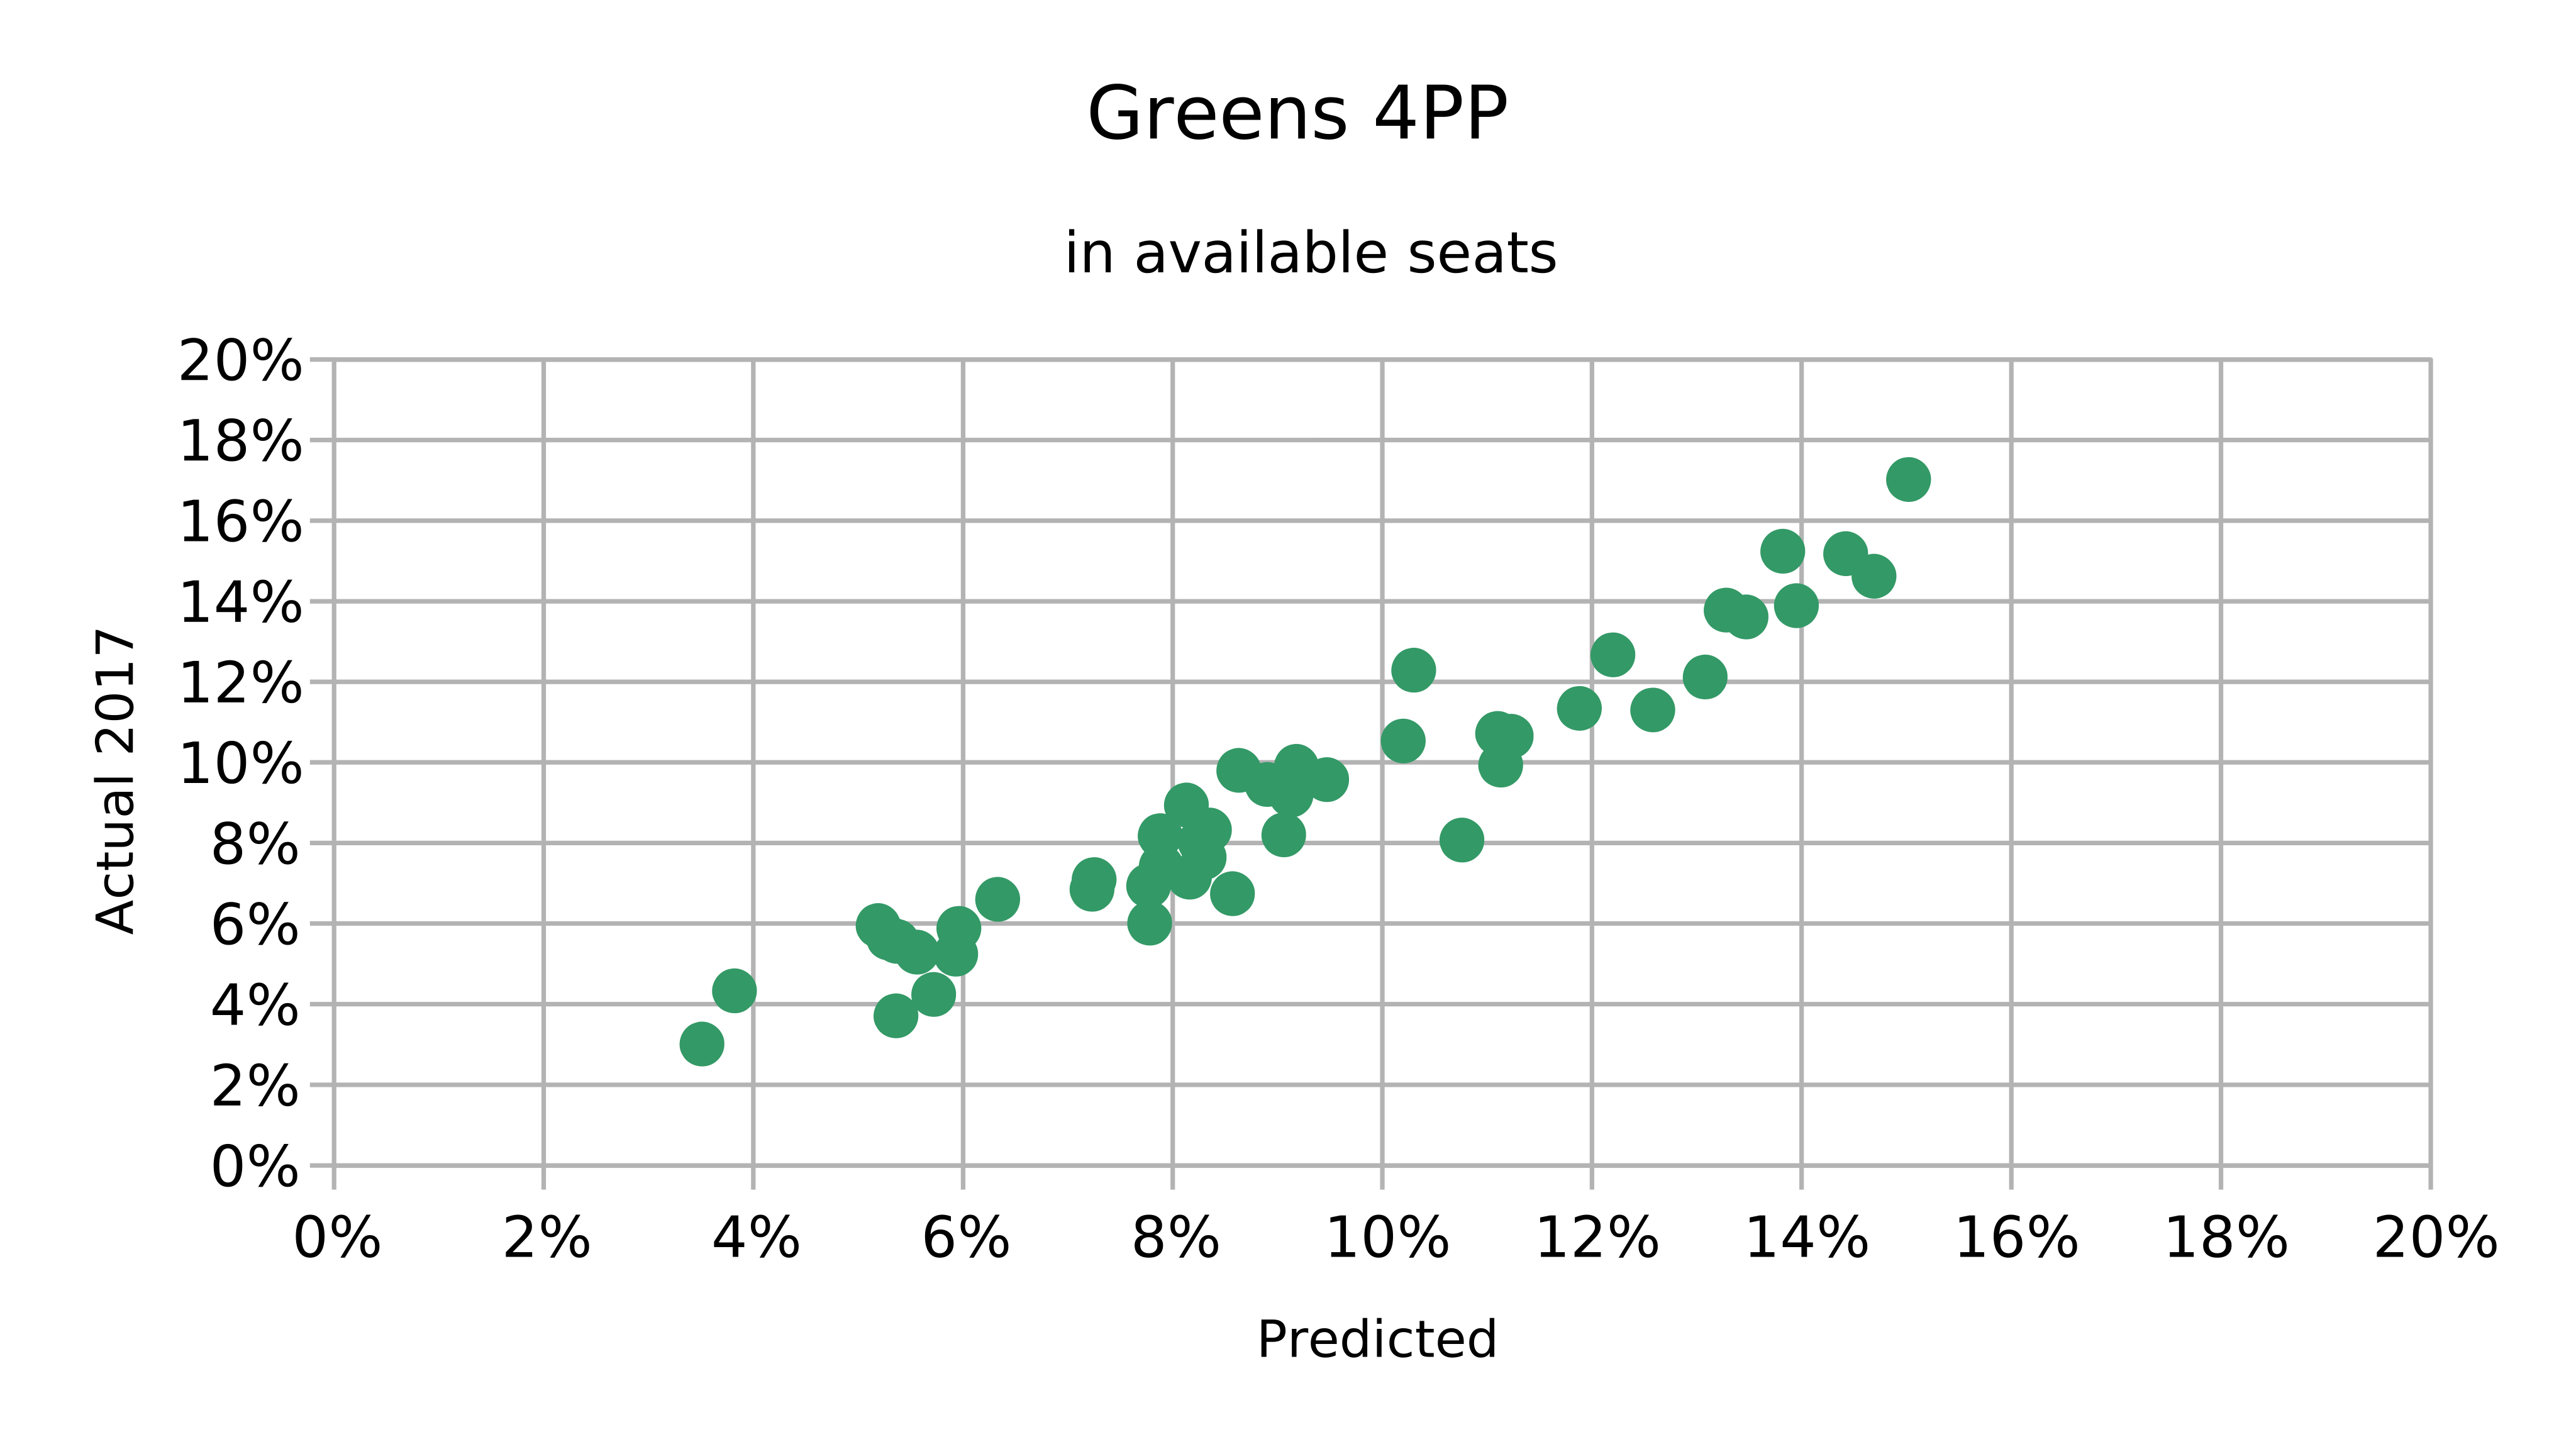
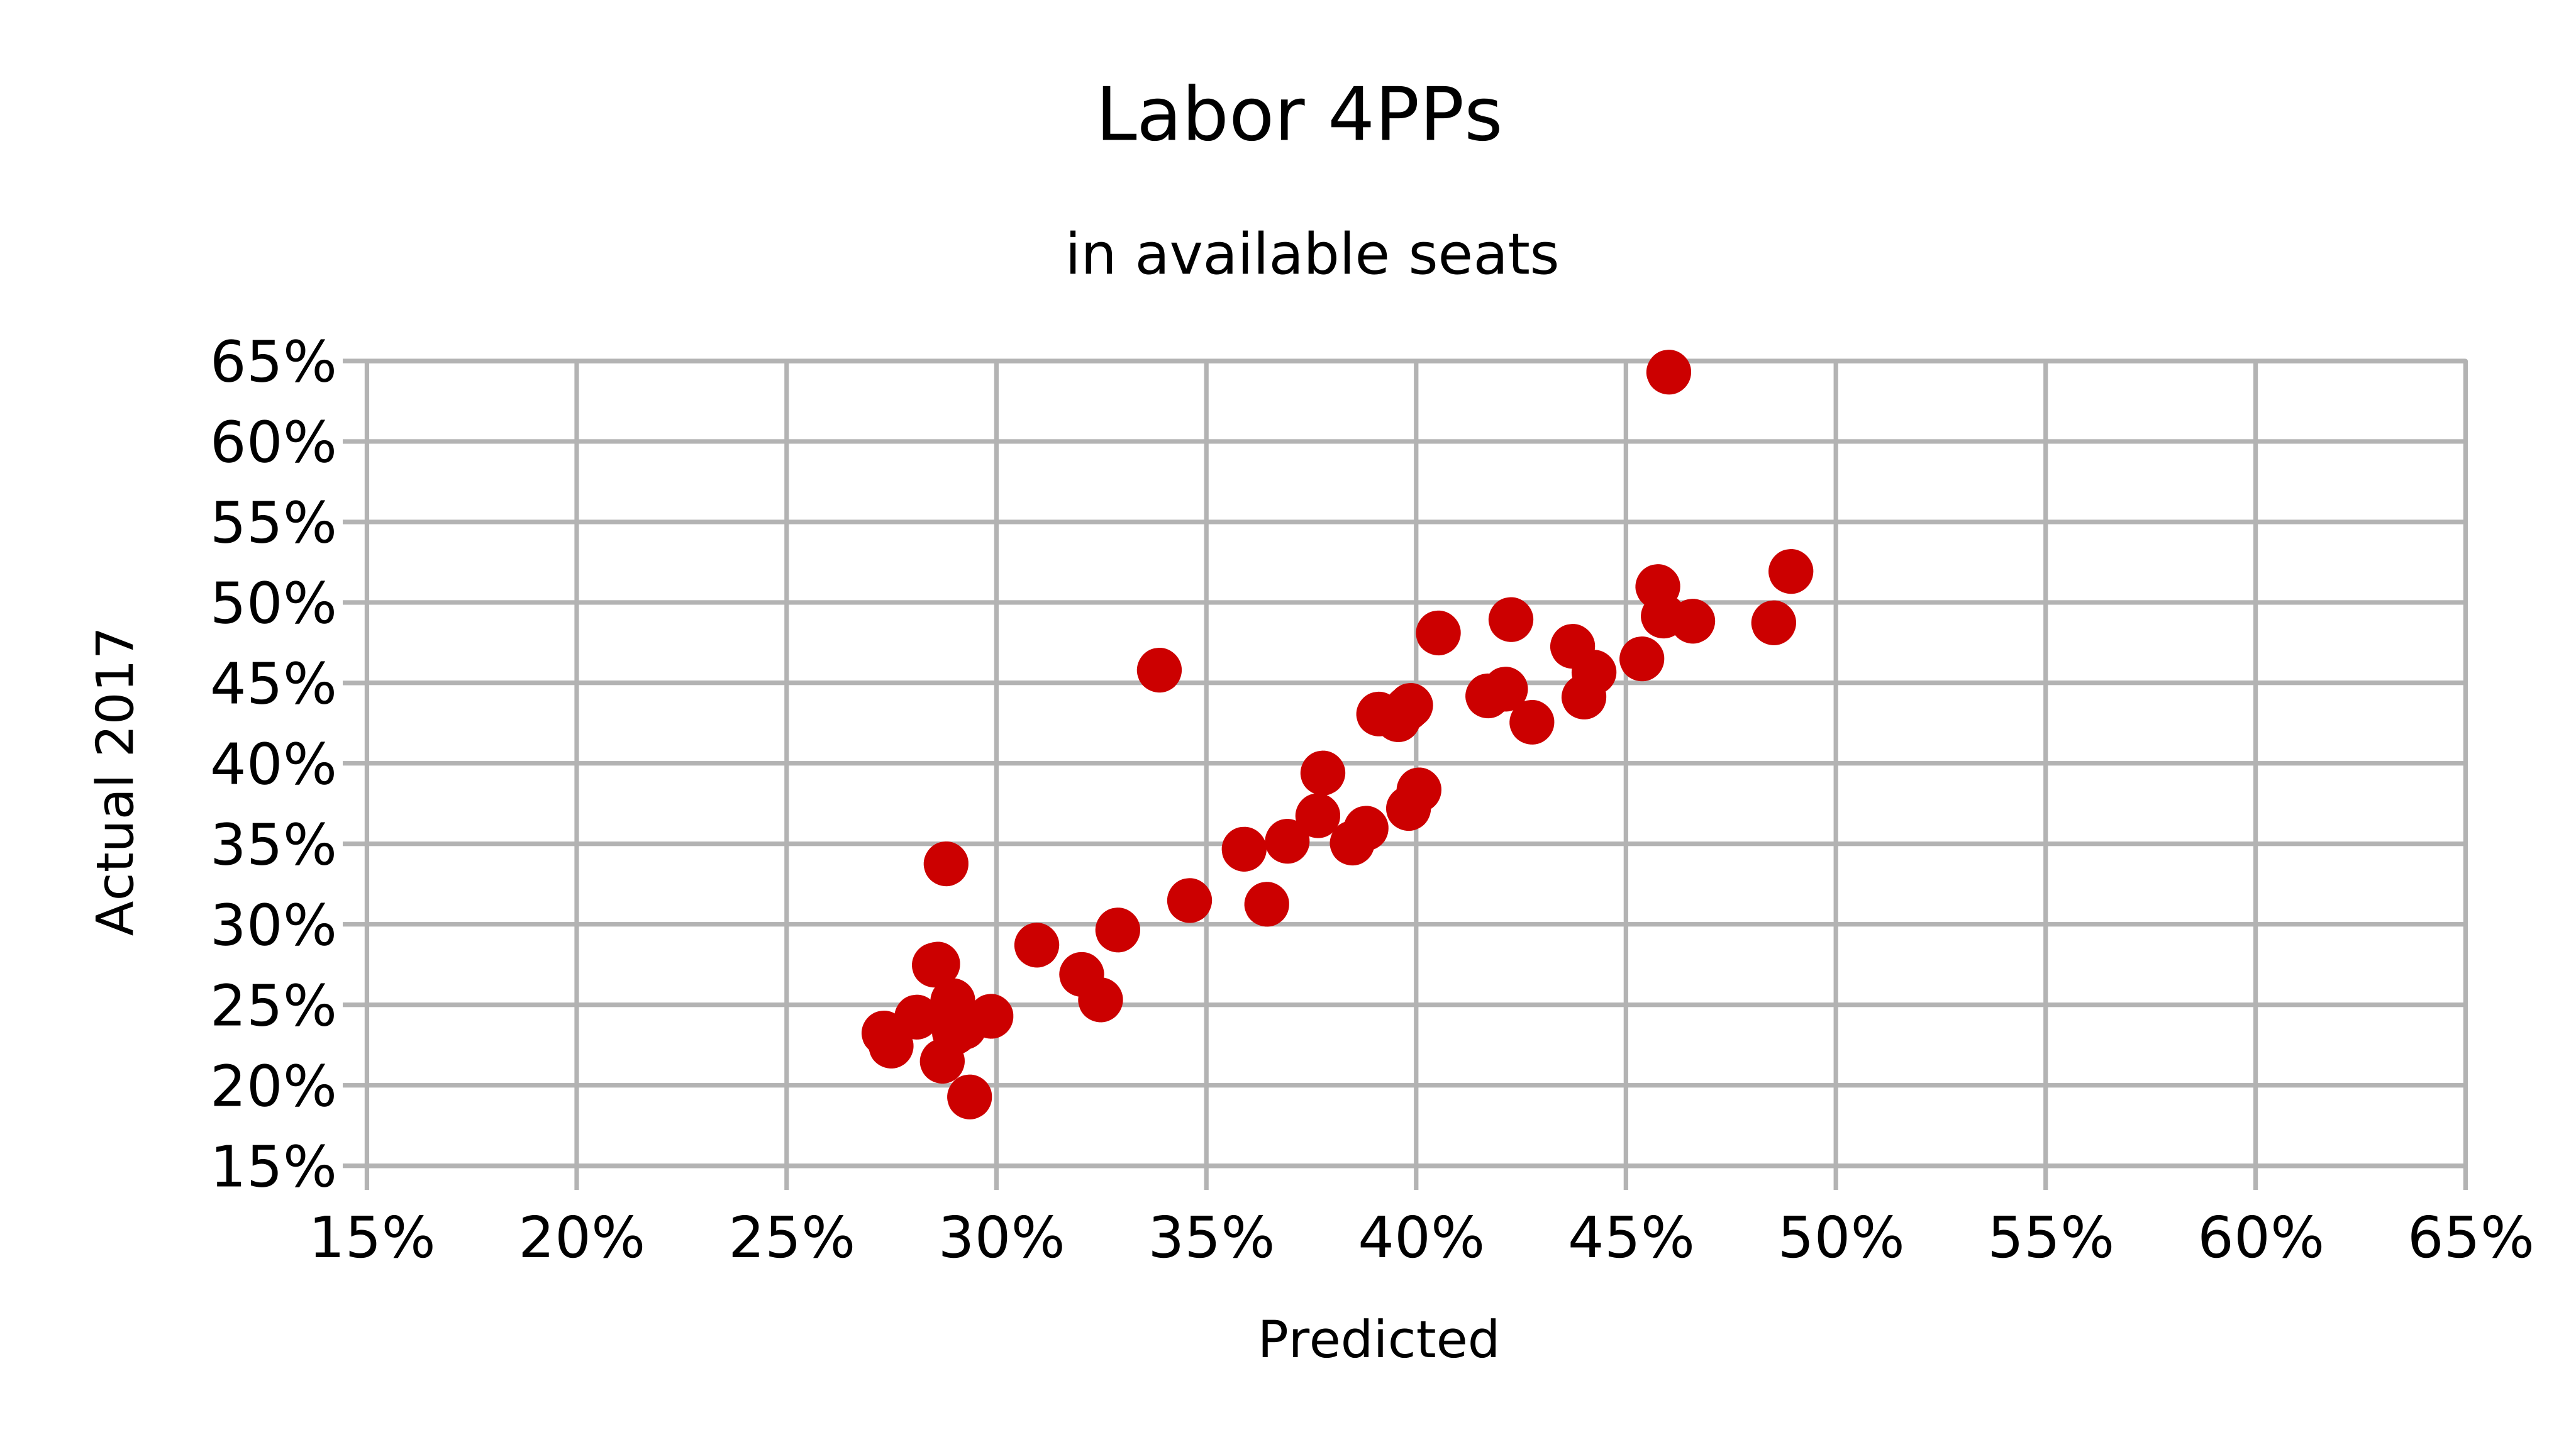
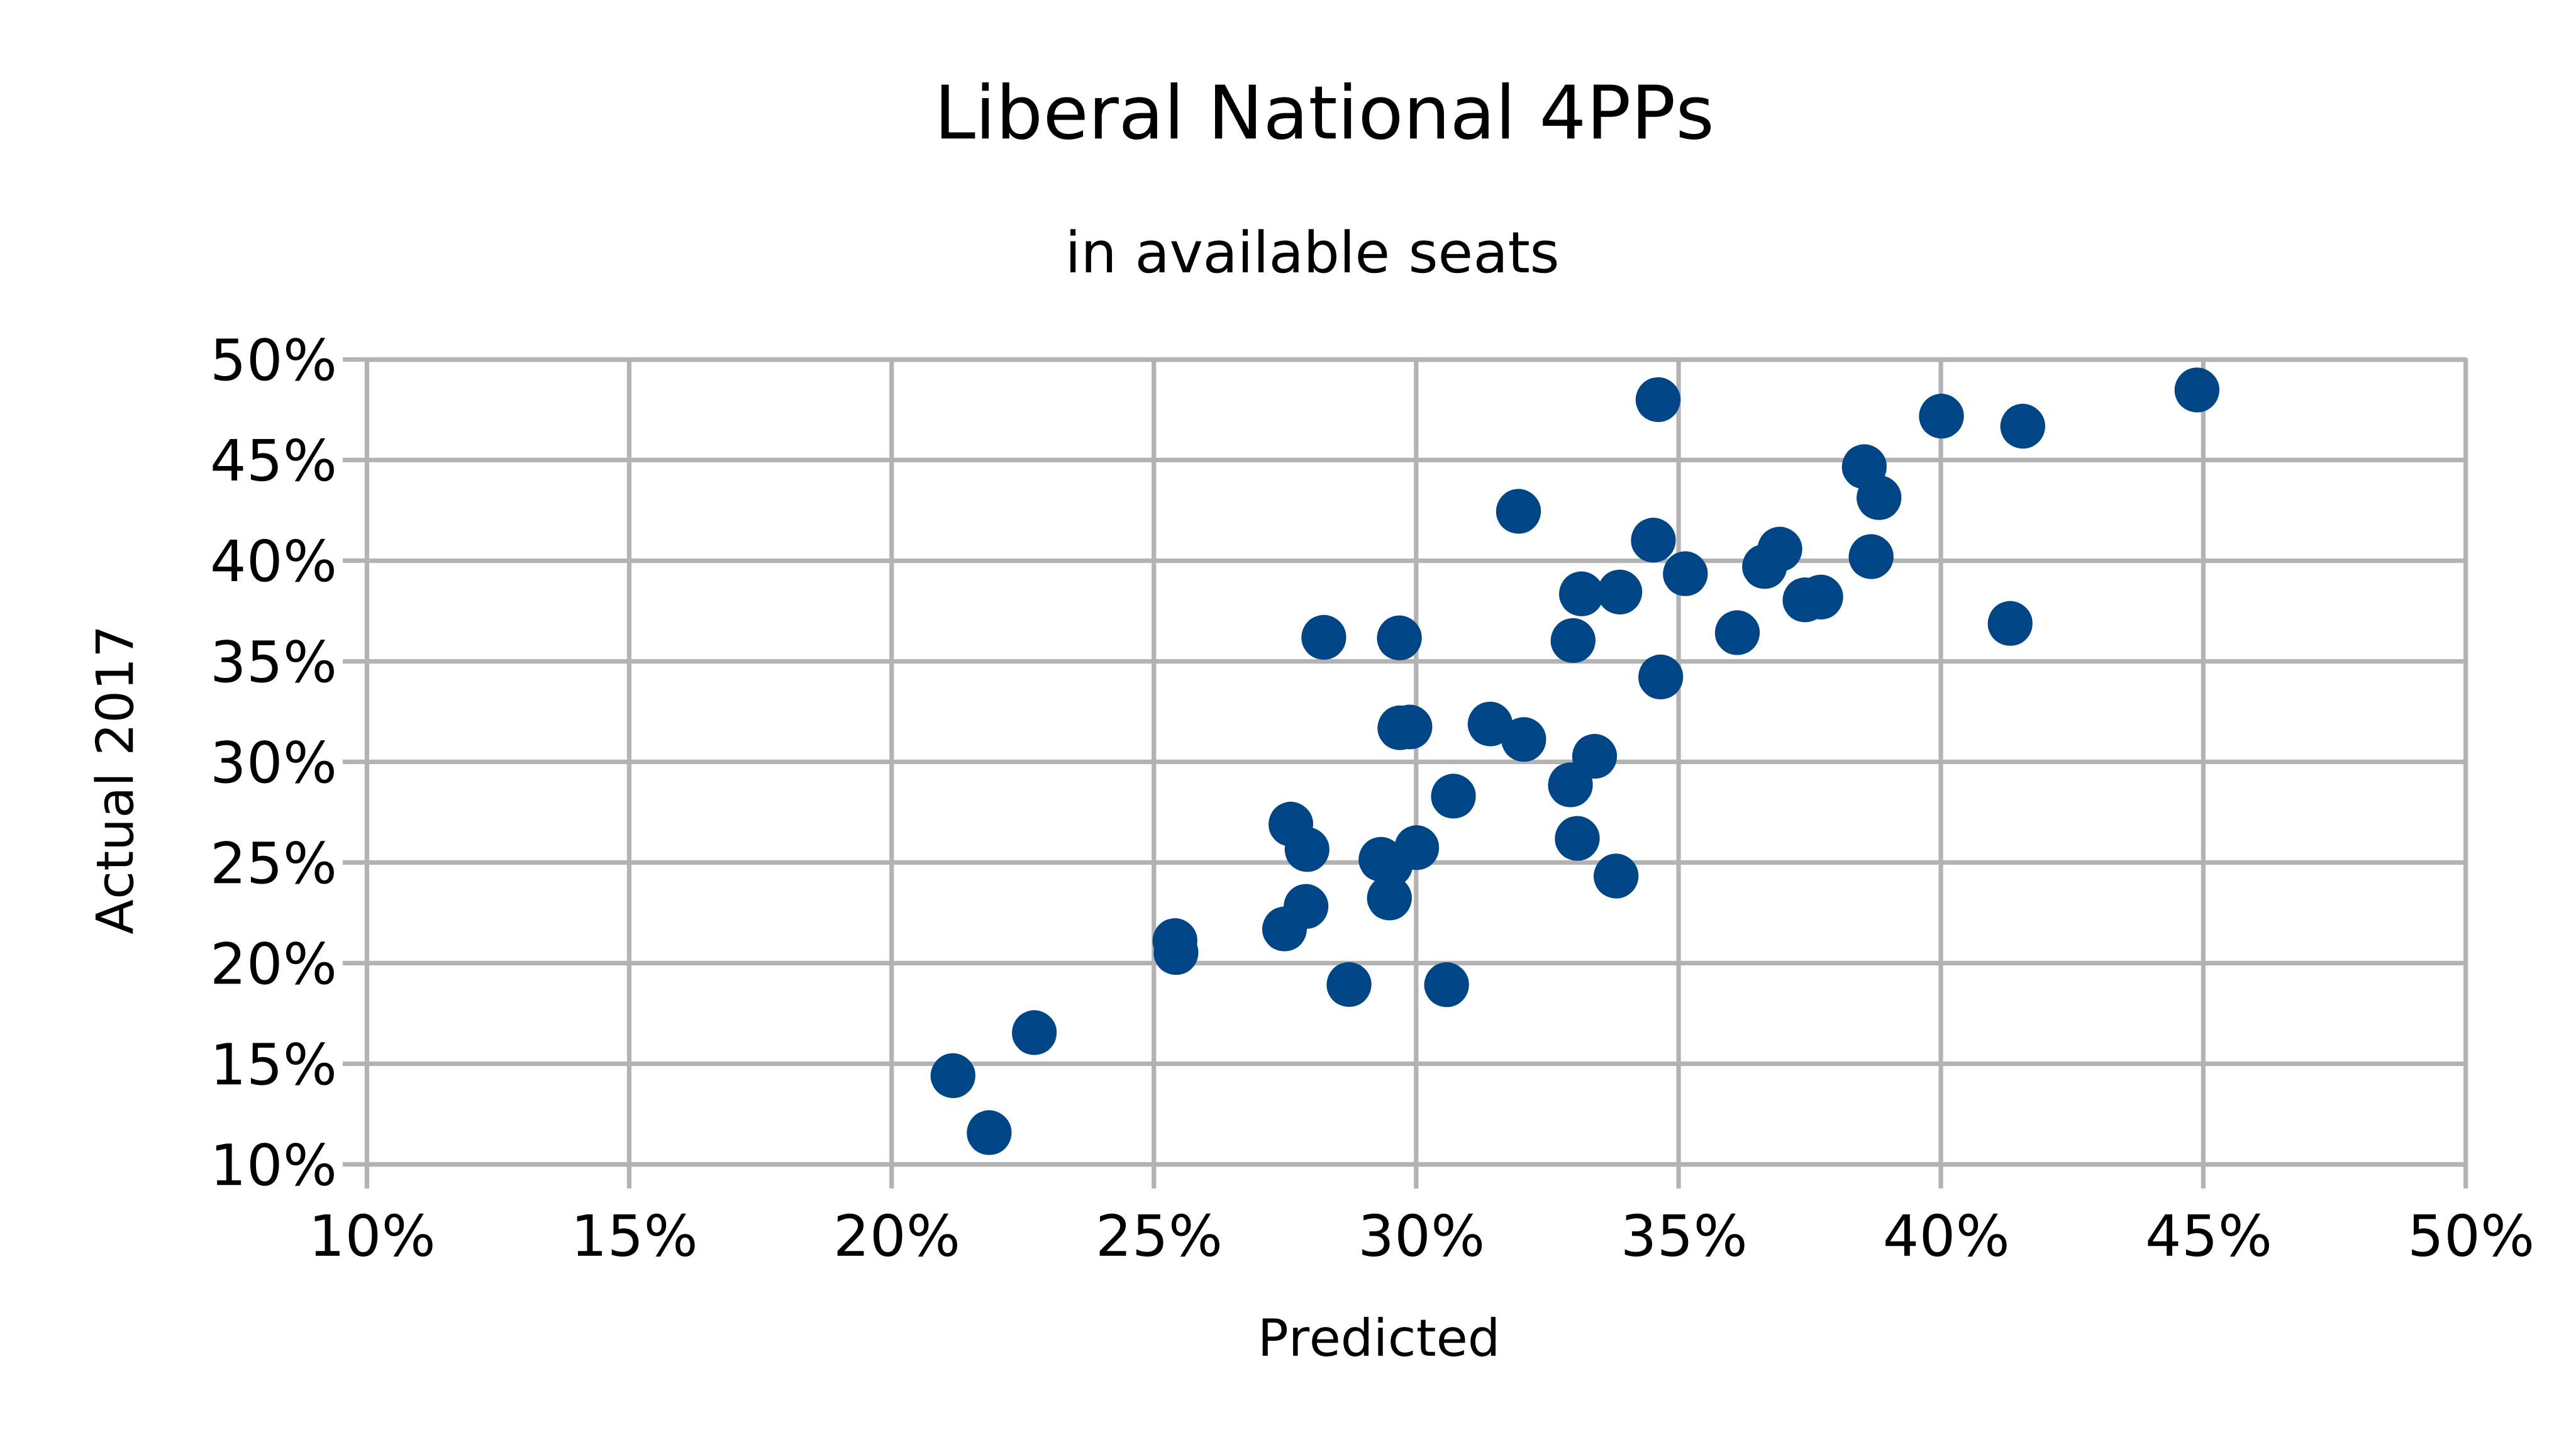
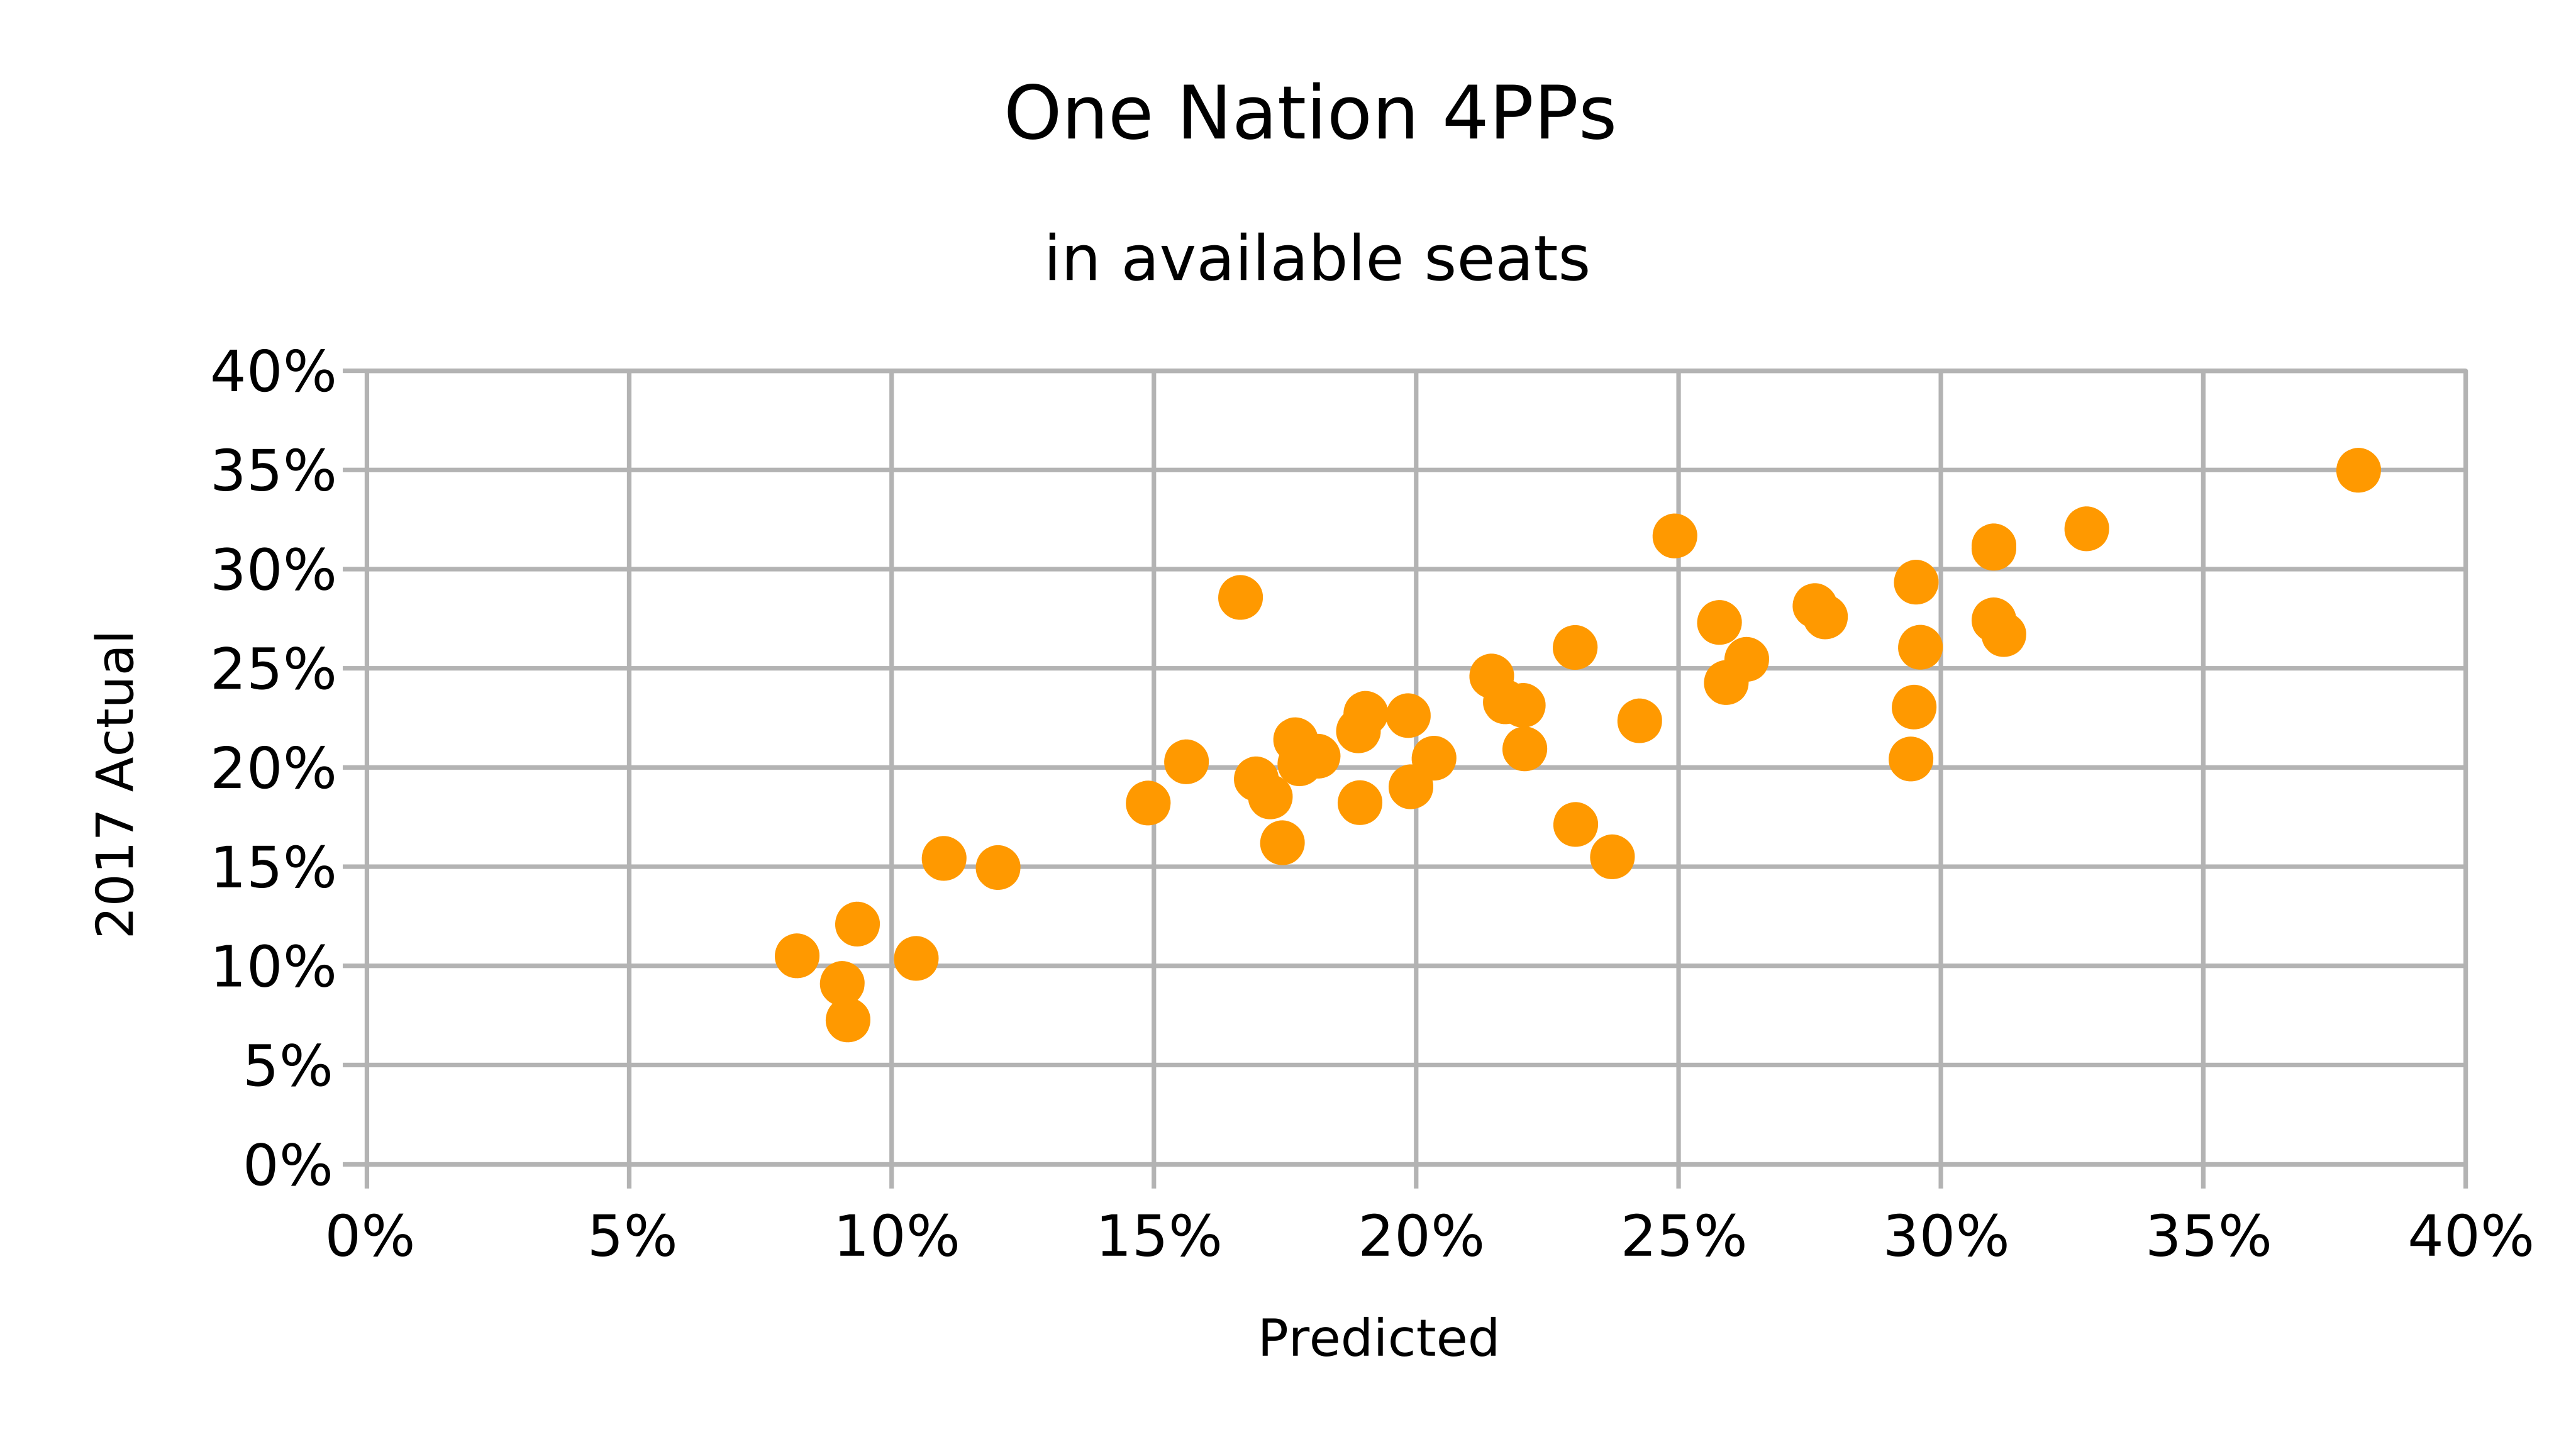
In the 46 seats where a 4PP comparison was possible, the predicted 4PPs
were generally a little higher than what actually happened, in line with
the apparent-lack-of-normalisation issue.
| Greens |
- 0.08% |
± 0.54% |
| Labor |
- 0.99% |
± 3.35% |
| Liberal National |
- 0.07% |
± 4.38% |
| One Nation |
+ 0.14% |
± 2.42% |
*Median difference is calculated as the median of the actual results
minus the predicted results. Median error is calculated as the median of
the absolute differences between actual and predicted.*
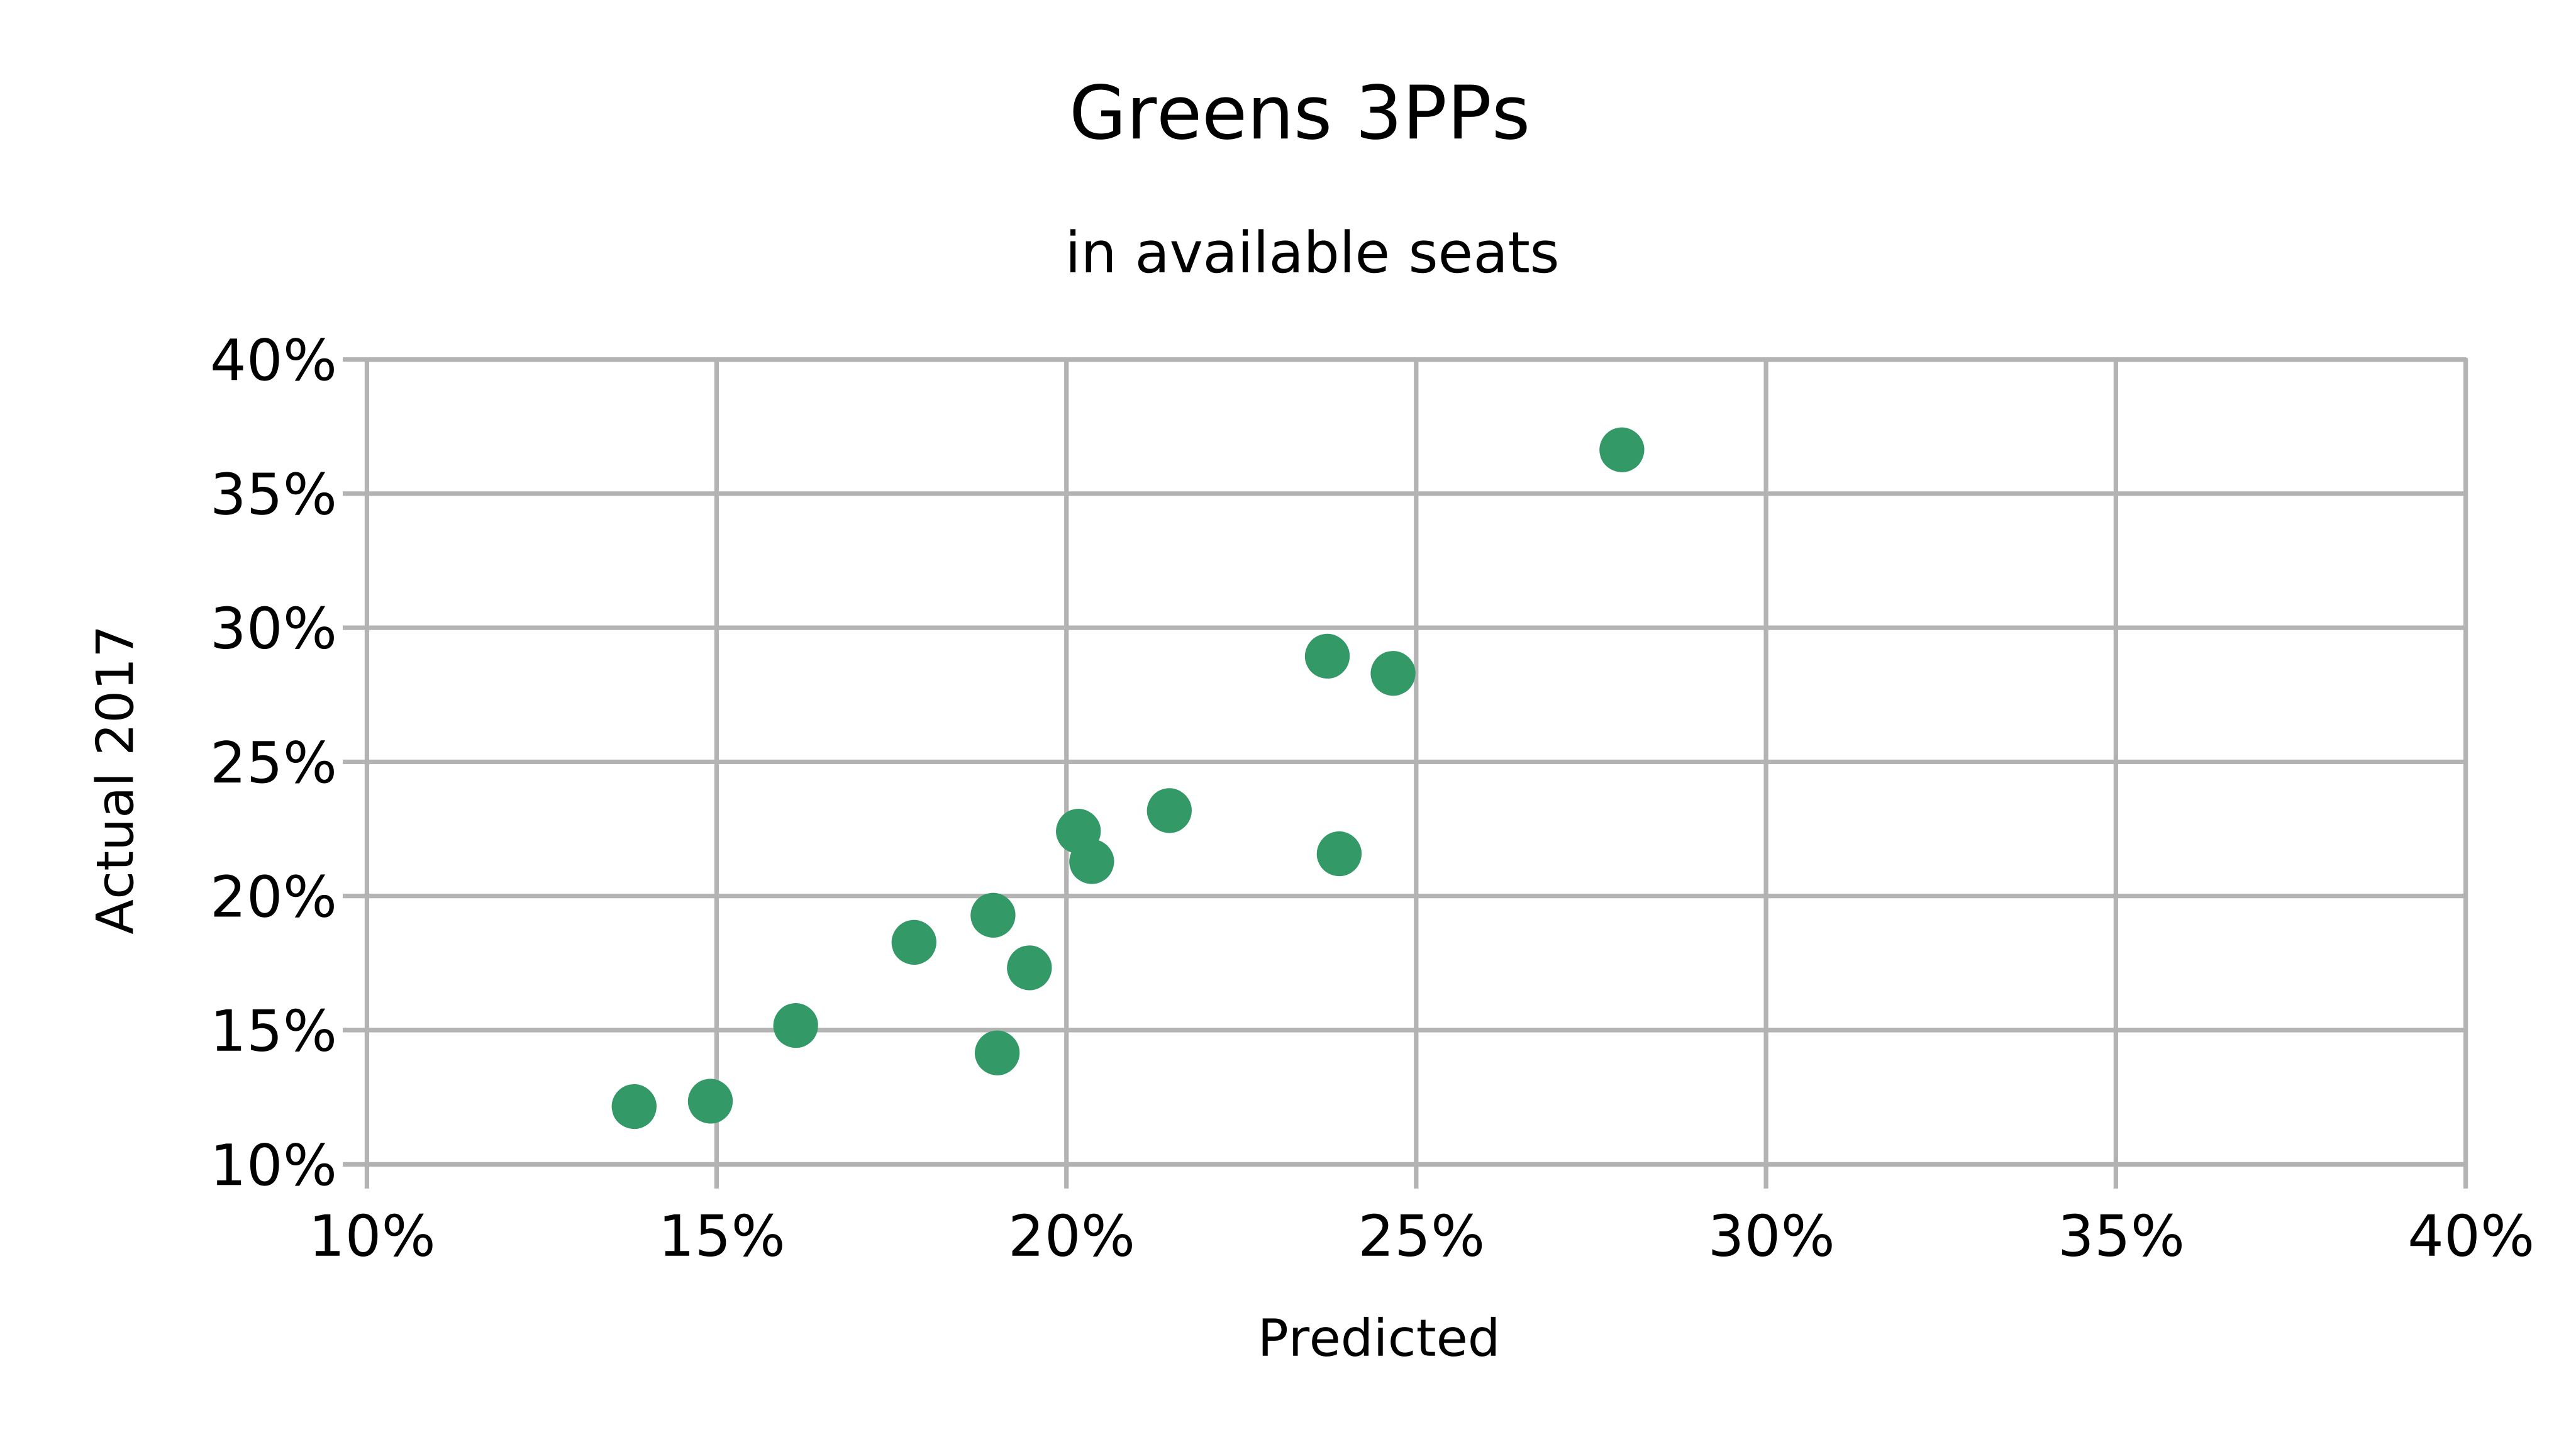
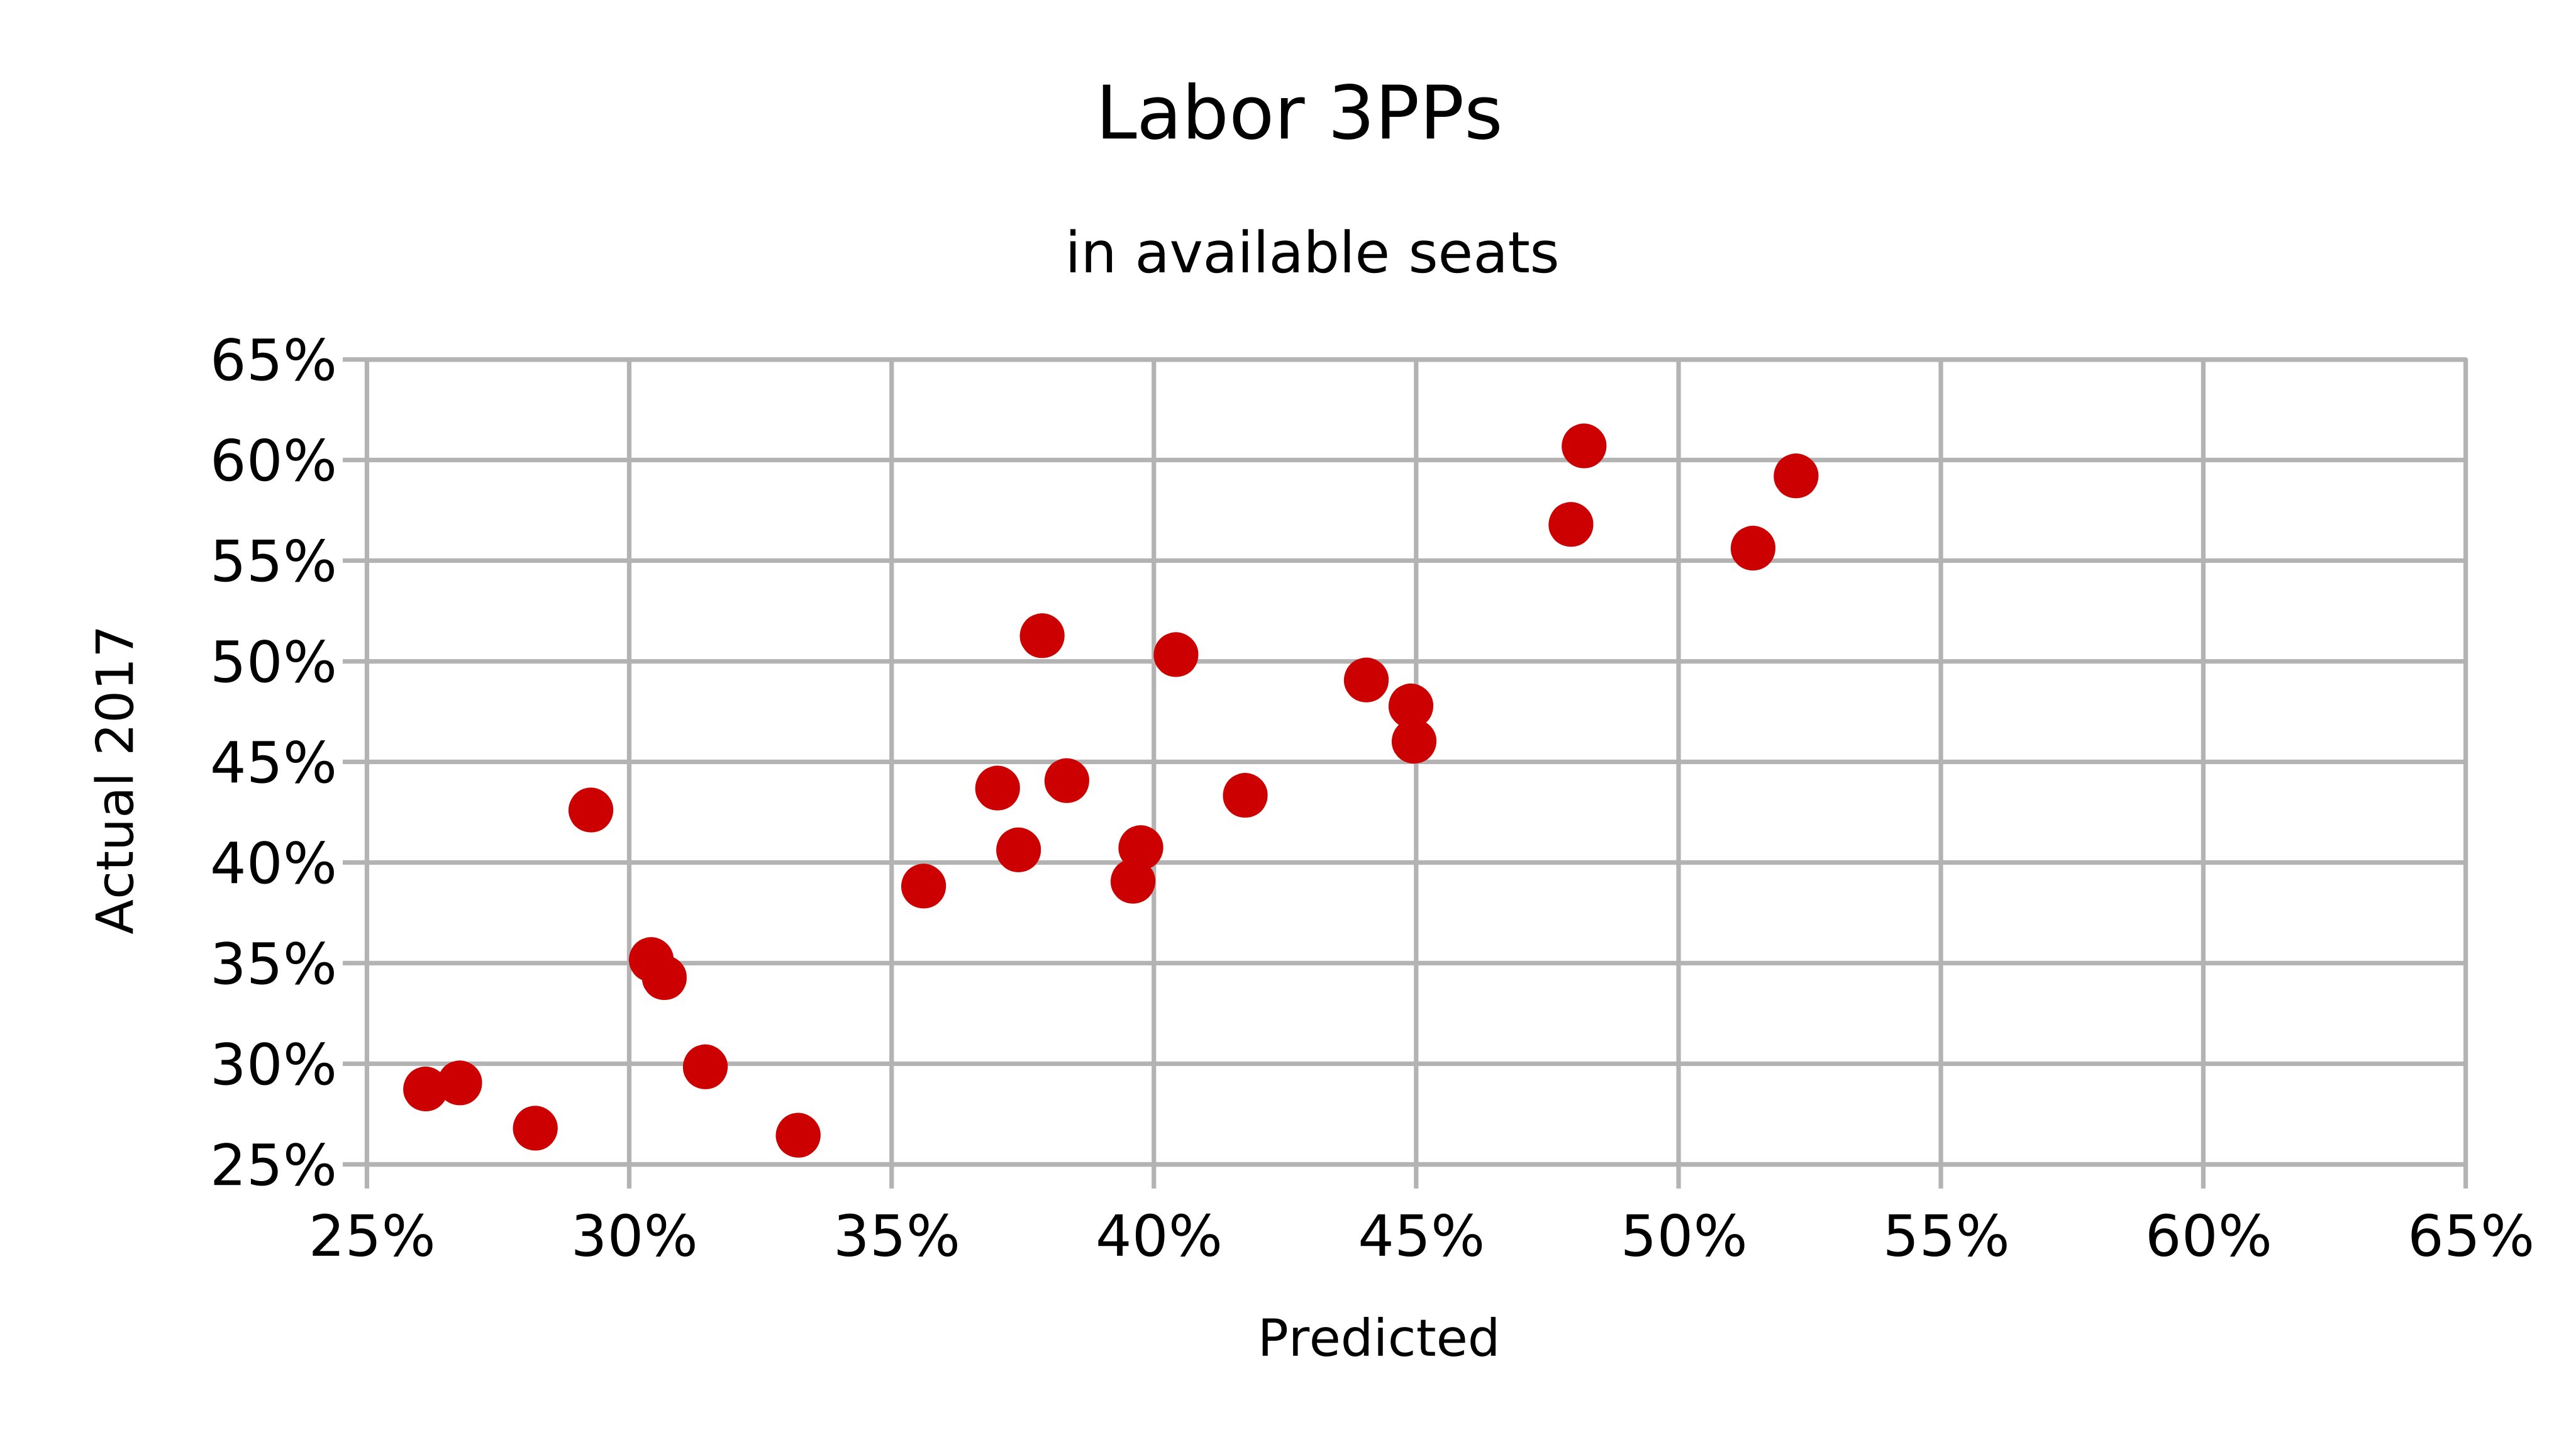
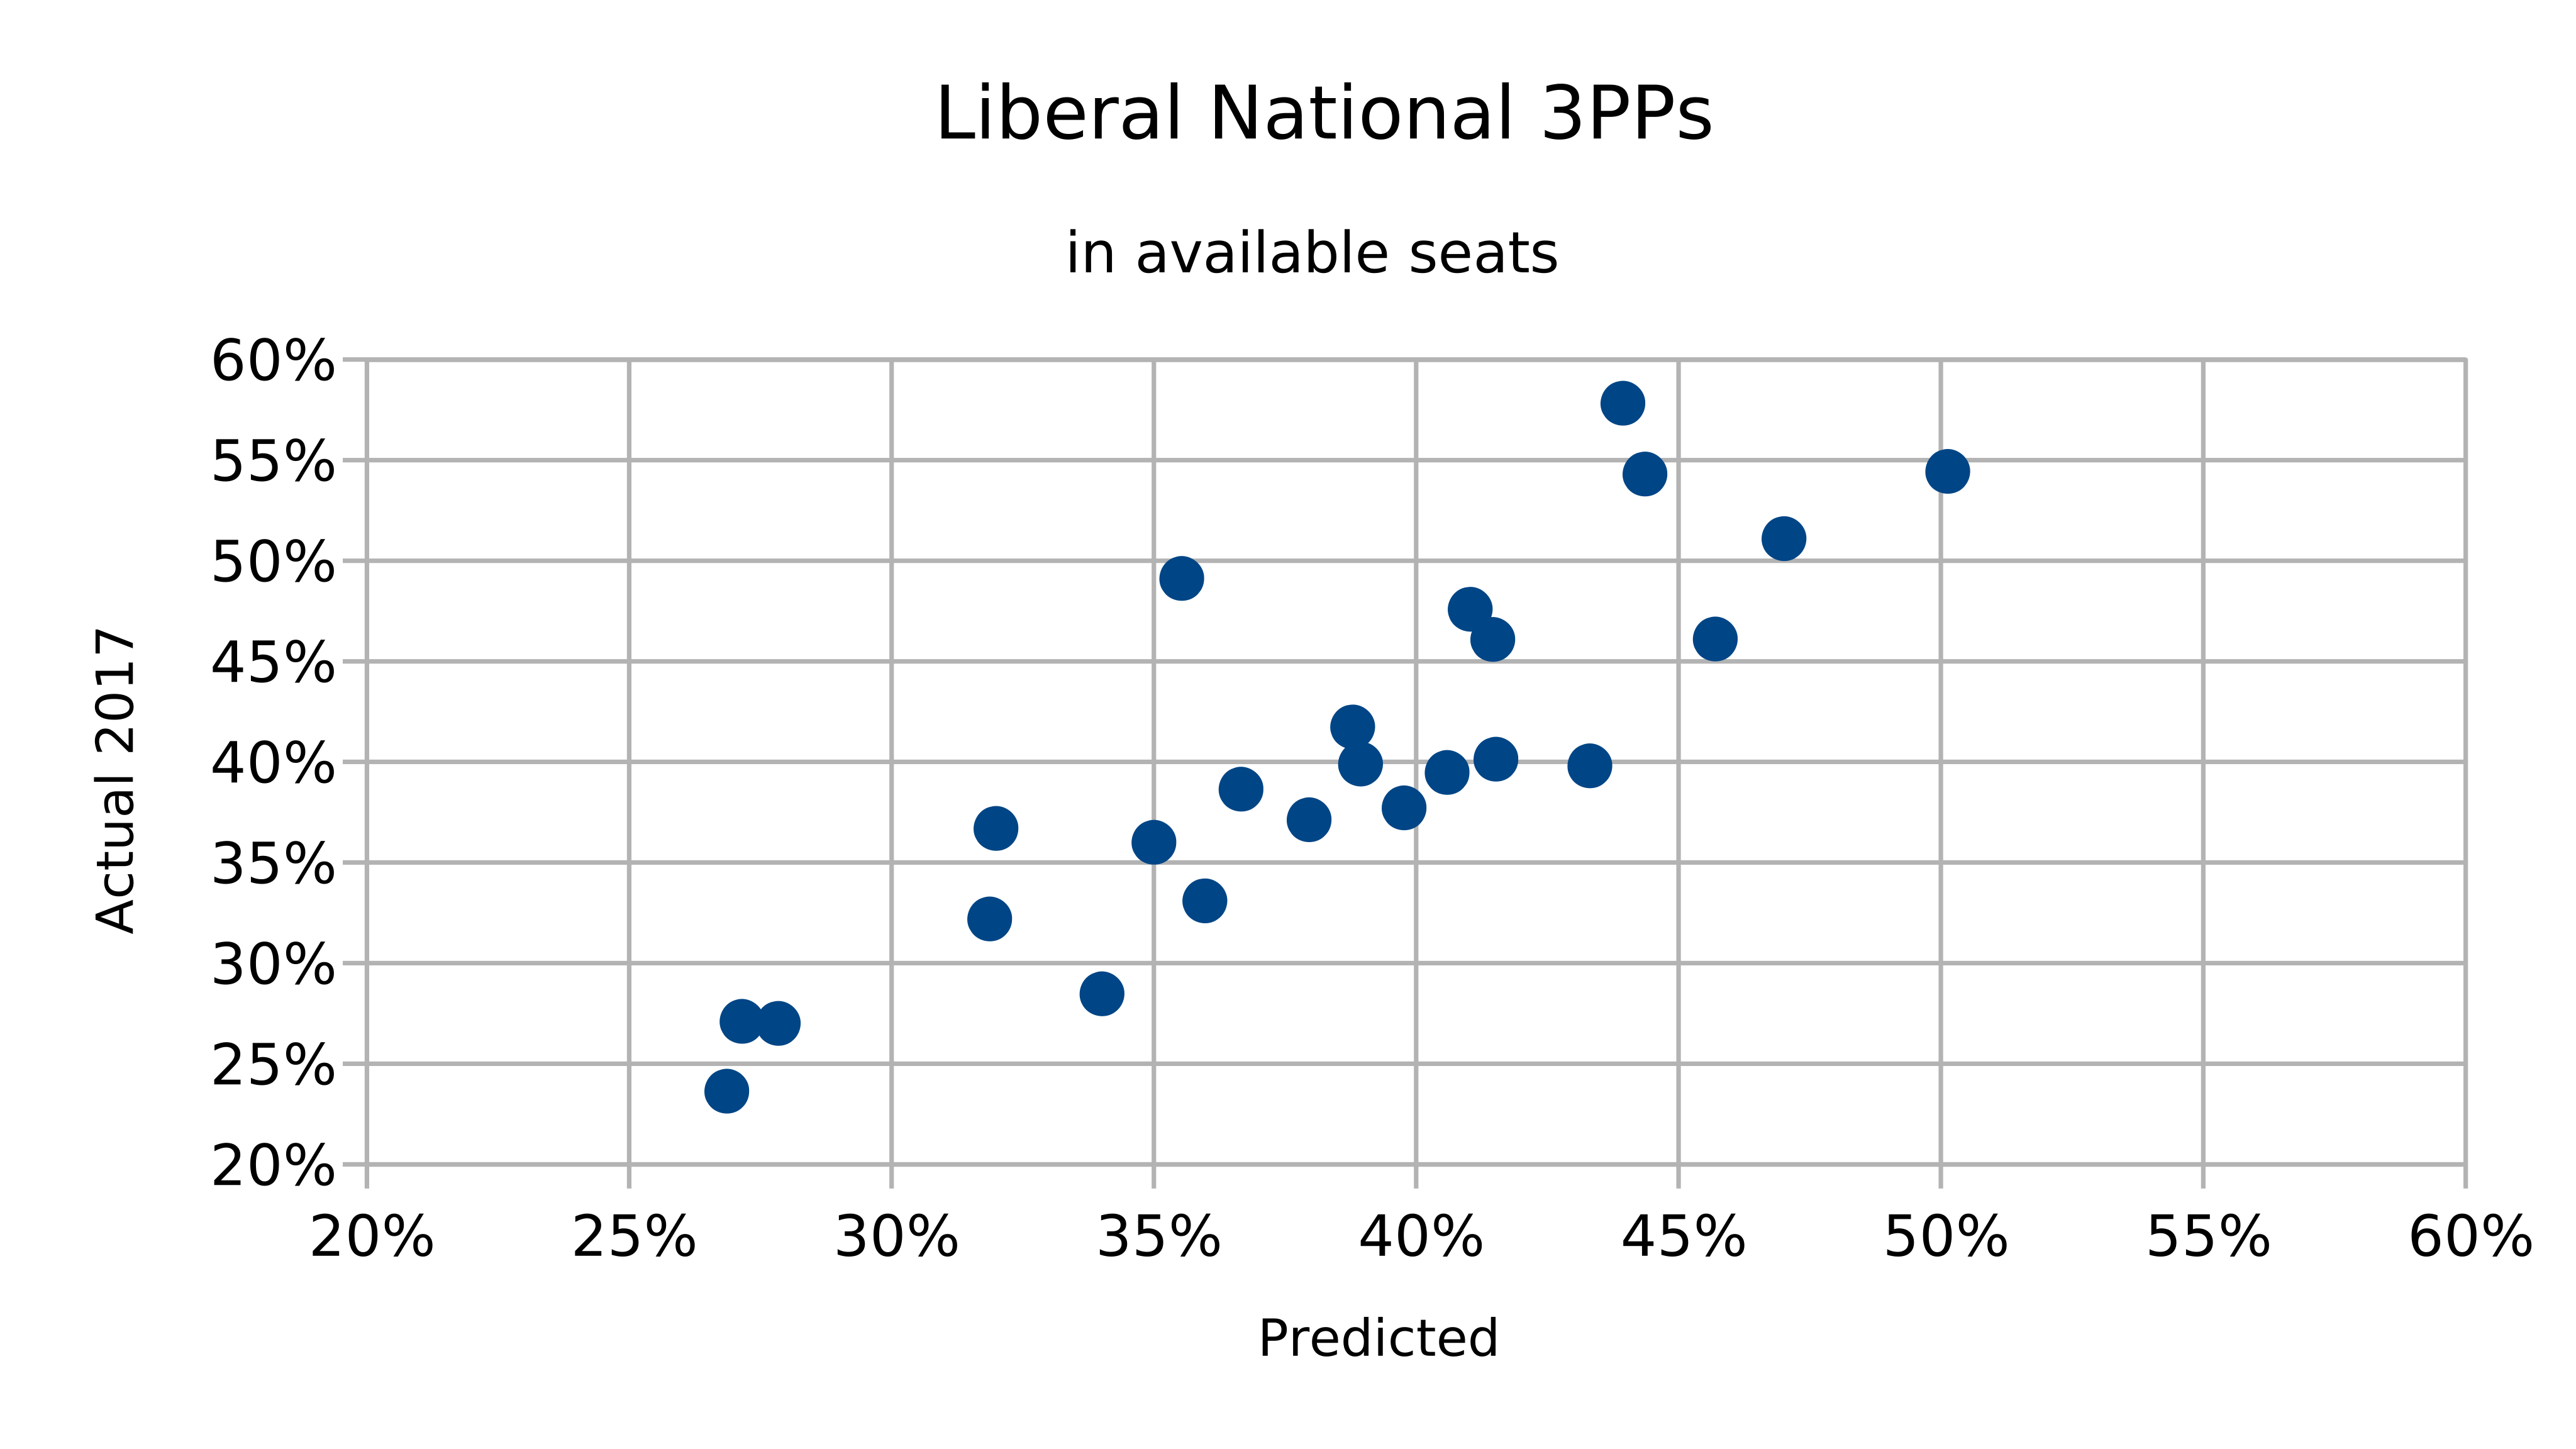
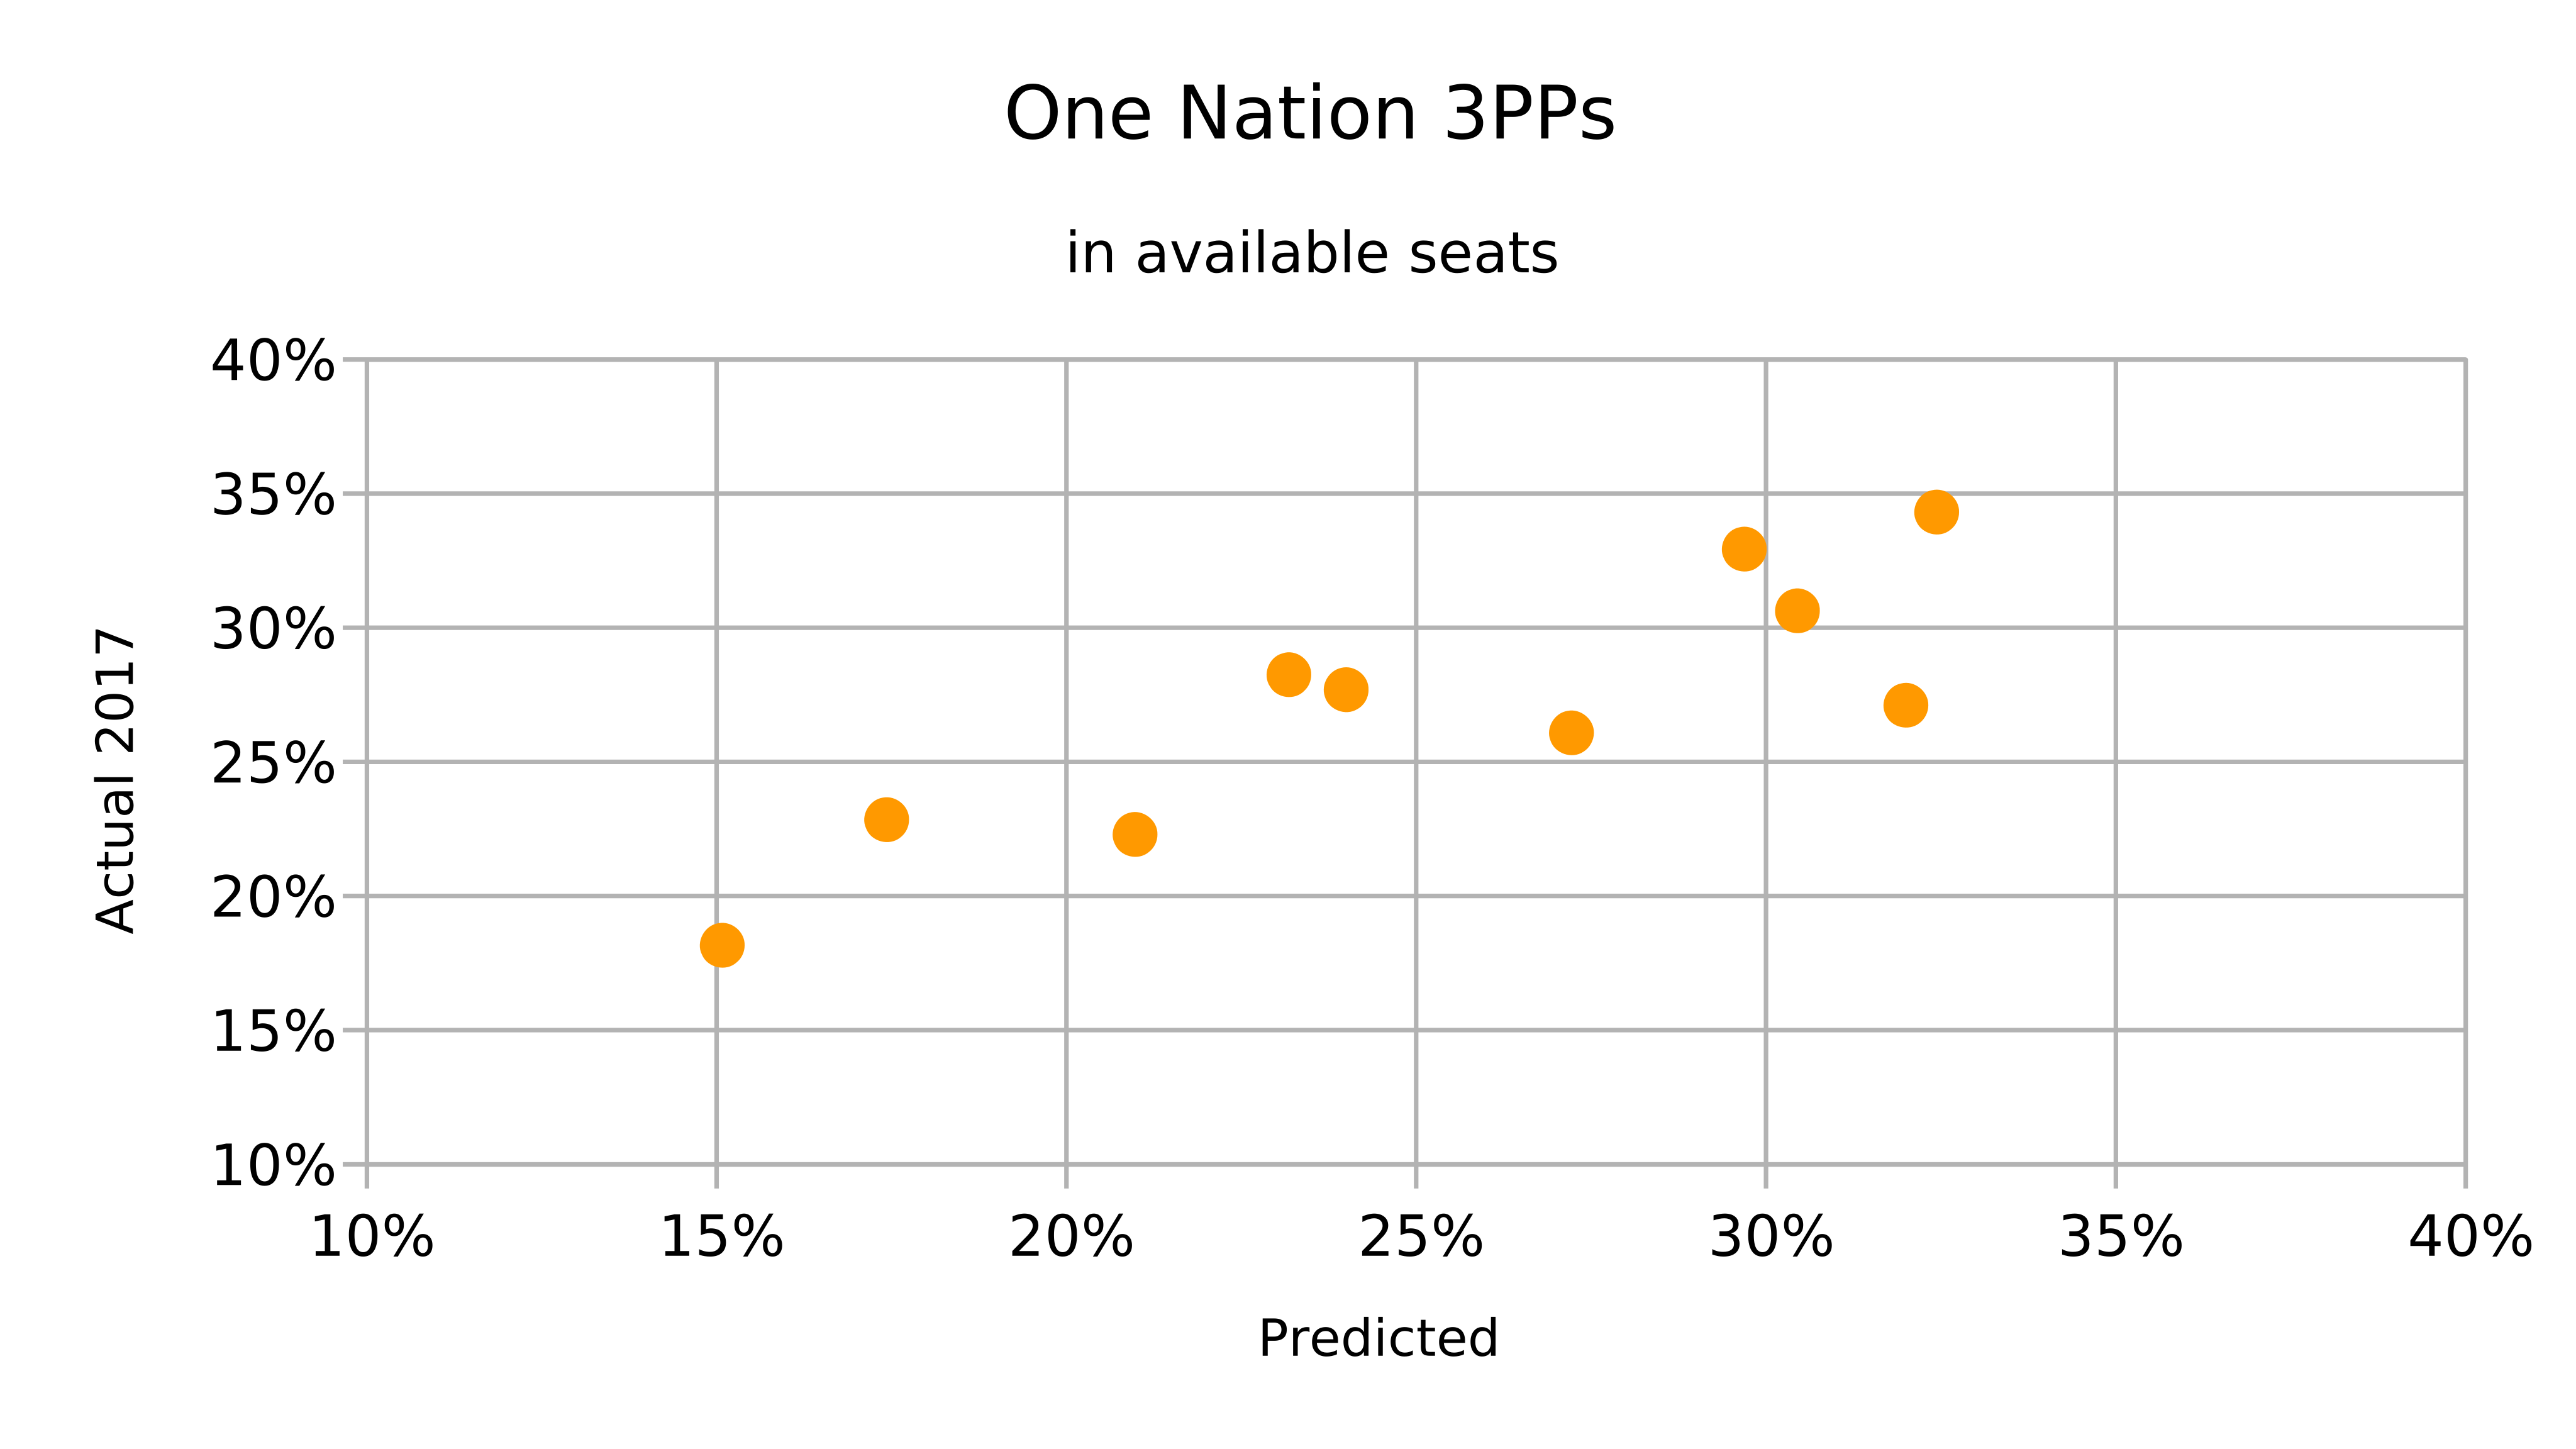
### 3PP comparisons
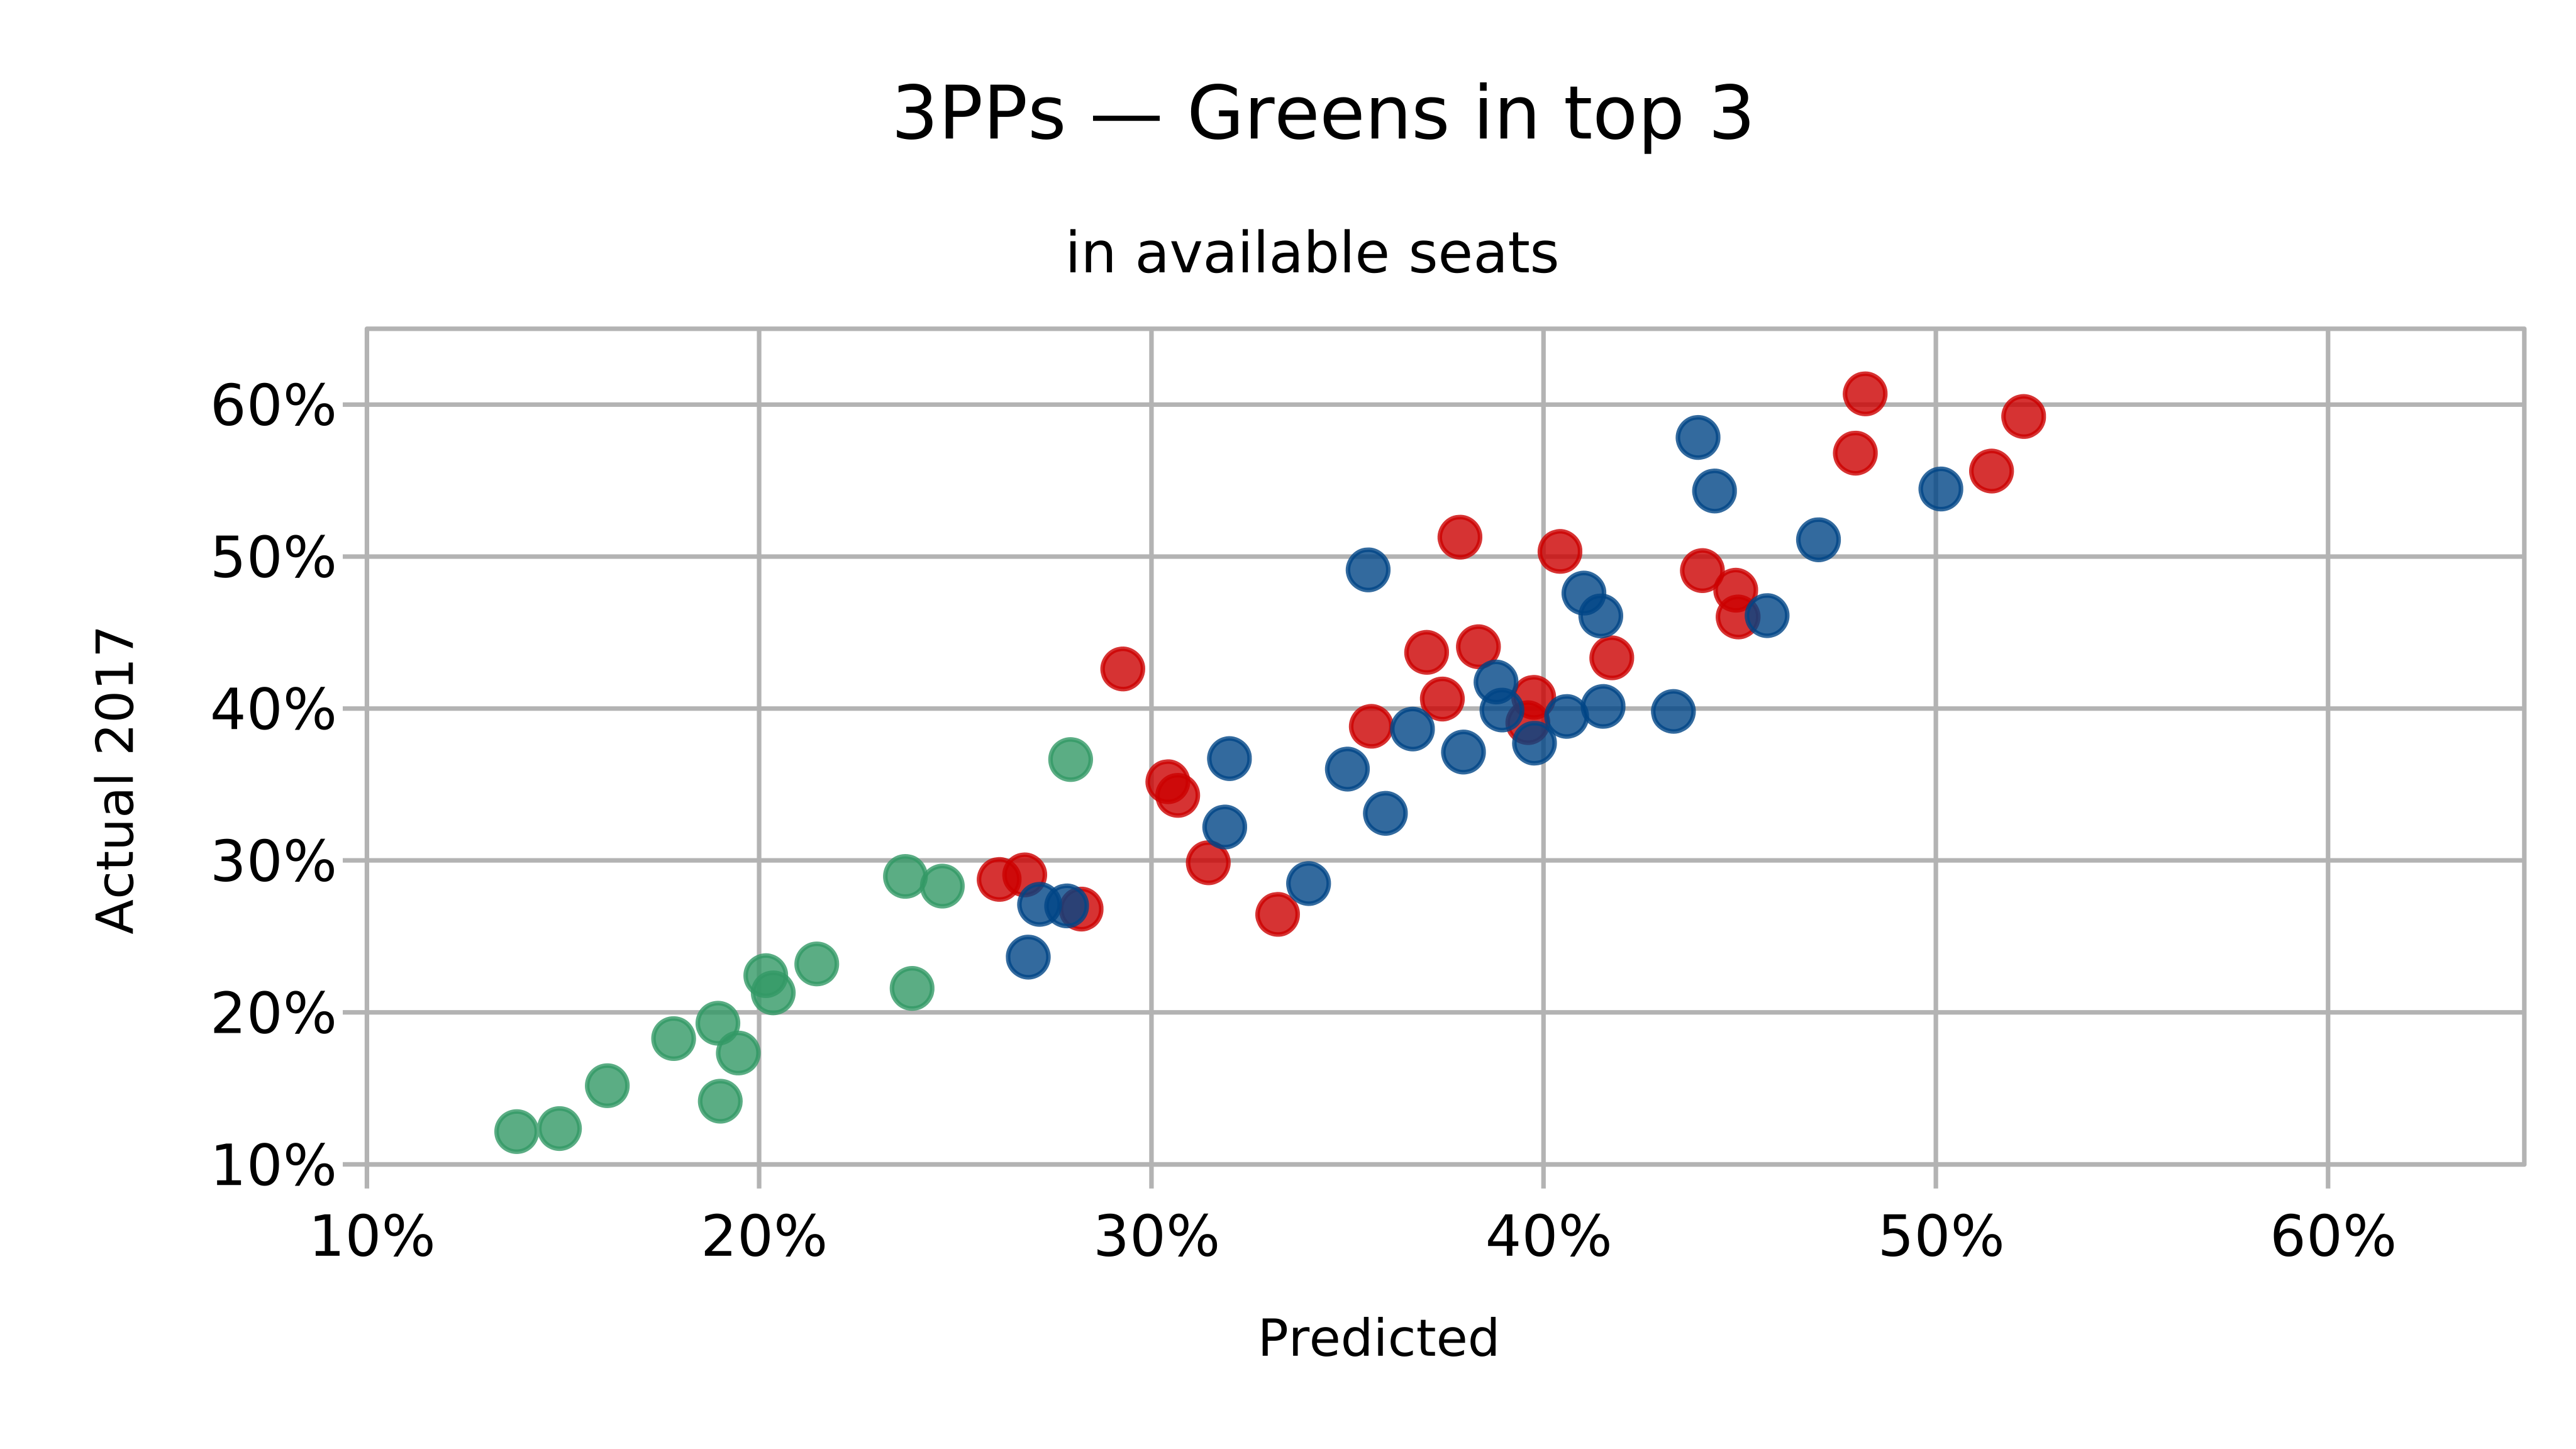
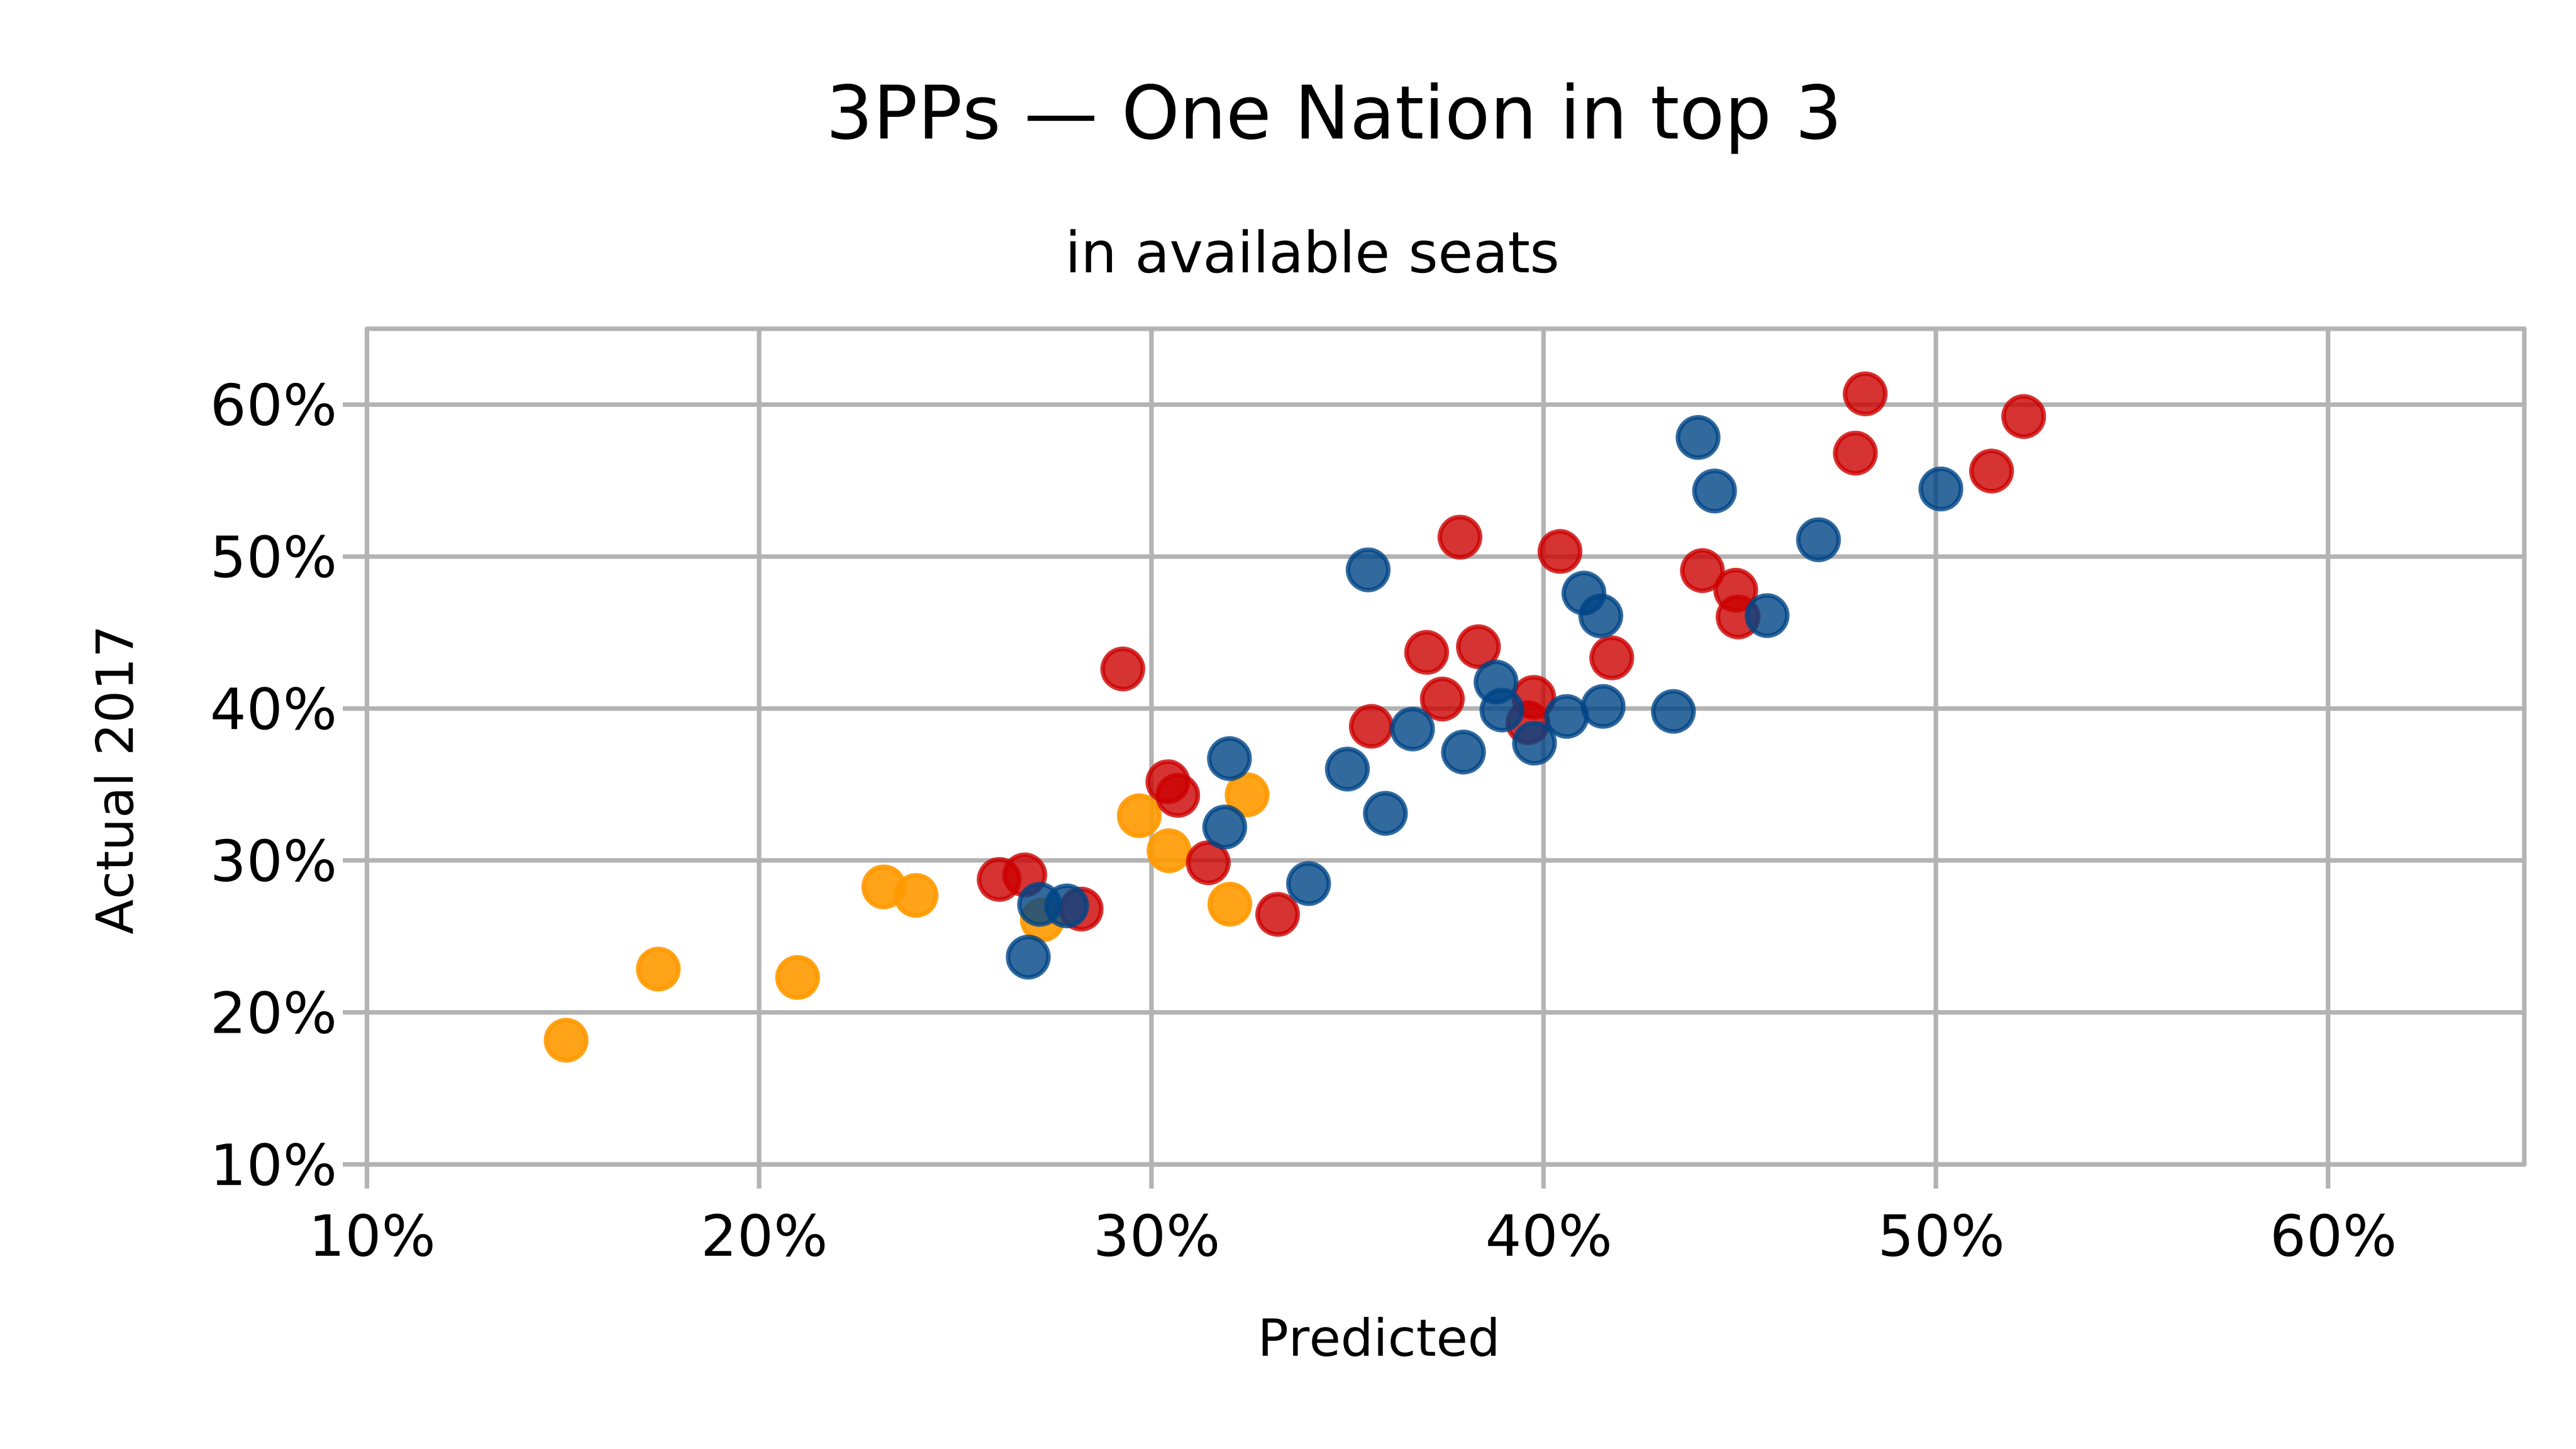
67 districts had the same top 3 both in the prediction and in reality.
In 24 of those, a 4PP comparison was not possible but a 3PP was.
| Greens |
+ 0.39% |
± 2.29% |
| Labor |
+ 3.41% |
± 4.48% |
| Liberal National |
+ 0.68% |
± 2.92% |
| One Nation |
+ 2.48% |
± 3.39% |
*Median difference is calculated as the median of the actual results
minus the predicted results. Median error is calculated as the median of
the absolute differences between actual and predicted.*
### Summary
The “2PP” and “3PP” statistics should be read as `correct winners` `/`
`correct top-n`.
Example: in 48 of the 58 predicted-Labor seats, the predicted top-two
matched the real top-two, and in 37 of those 48 seats the winner was
indeed Labor.
| Greens |
0 |
— |
— |
— |
1 |
| Labor |
58 |
46 |
37/48 |
35/45 |
48 |
| Liberal National |
28 |
25 |
20/21 |
17/18 |
39 |
| One Nation |
7 |
1 |
1/3 |
1/4 |
1 |
| Katter’s Aus. |
— |
— |
— |
— |
3 |
| Independent |
— |
— |
— |
— |
1 |
I want to repeat for emphasis that **the model ignores Katter**, and
treating Katter as a One Nation proxy greatly improves One Nation’s
stats to 4/7 correct wins, 2PPs and 3PPs.
------------------------------------------------------------------------
## Conclusion
I think this was an OK first attempt. The estimated 4PP values are still
only estimates, but they give results that are substantially closer to
what happened in 2017 than what happened in 2016, both in terms of seat
results and in terms of median error.
Probably the weakest part of the model now is in changes in preferencing
behaviour. With Senate preferences optional and only Labor and the
Greens swapping preferences then, LNP—One Nation flows were likely much
weaker in 2016 than 2017. Similarly, 2017 probably saw a much stronger
flow from Labor to the LNP over One Nation.
The final difficulty remains estimating statewide nominal 4PPs once
pollsters account for candidacy. I don’t have a solution for that one
yet.
*Thanks for reading and I’ll see you around!*